Curated OER
Accounting - Analyzing Transactions to Debit/Credit Parts
Students are introduced to how transactions are analyzed with debits and credits. In groups, they complete a T-chart in which the account increases with credits and decreases with debits. To end the lesson, they analyze the various...
Curated OER
Associative and Commutative Properties
Seventh graders define the commutative and associate properties and extend commutativity and associativity to objects. They define rational numbers and review the order of operations and multiplying/dividing integers chart. In addition,...
Curated OER
Graph Lab
Seventh graders explore bar graphs and pie charts. Given a pack of M&Ms, 7th graders explore the colors, sort the data in a frequency chart and then construct bar graphs and pie charts to categorize the M&Ms by color. Students...
Curated OER
M&M's Candies Worksheet Graph
In this graphing worksheet pupils will record data on a bar graph. Students will take a bag of M&M's and chart the colors they find inside this bag.
Curated OER
Pumpkin Seed Experiment
In this unique lesson students participate in a pumpkin seed experiment. Students interact with the pumpkins weight, seeds and record their findings of what lies within the pumpkin once the top of the pumpkin is cut off for observations....
Curated OER
Roll-a - Turkey
In this Thanksgiving worksheet, students play a drawing game with dice. Following the directions on the chart, students roll the dice and draw the turkey part that the number indicates. The winner of the game has a full turkey drawing.
Curated OER
Ounces And Pounds
In this math worksheet, students determine the best measurements to use for 26 objects. Students analyze a chart of ounces and pounds to help them with the problems.
Curated OER
Piece of Pie Chart
In this math worksheet, students examine a pie graph which shows a student's homework over 2 hours. Students read the information, then use a pie chart template (divided into 24 parts) to make their own homework chart.
Curated OER
Measurement and Precision
In this math learning exercise, students make an estimation of the measurement of an object and find the actual measurement. Students chart their estimation and their measurement.
Curated OER
12 x 12 Multiplication Table
In this multiplication activity, students chart the answers for all multiplication facts up to and including the twelve times table. This can be used in various ways to reinforce understanding of multiplication facts.
Curated OER
10 x 10 Multiplication Table
In this math activity, students show an understanding of multiplication facts up to the ten times table. This chart can be used in various ways to reinforce memorization of the times tables up to ten.
Curated OER
Handling Data- Health Statistics
In this social studies worksheet, students organize 50 country cards into groups. Students analyze a chart and group countries according to lowest, middle, and highest Infant Mortality Rate.
Curated OER
Back to School Logic Puzzle
In this math instructional activity, students solve a logic puzzle using a chart to figure out which child wore which color backpack and was in what grade level.
Curated OER
Logic Puzzle
In this math worksheet, students solve a logic puzzle about who's gym bag belongs to whom. Students read 5 clues and complete a chart to help them discover the answer.
Curated OER
Math: Football League Statistics
Students examine a soccer league final standings chart and then answer 12 questions based on the information provided. They calculate some answers in both fractions and percentages.
Curated OER
Logic Puzzle-- Going to the Zoo
In this logic instructional activity, students solve a logic puzzle about the favorite animals and the T shirt color for five friends. Using the chart which is provided, students use logic to decide who liked what animal and wore which...
Curated OER
Round Each Number to the Nearest 100
In this math worksheet, students round 3 digit numbers to the nearest 100. In the chart students analyze the 3 digit number, check whether it should be rounded up or down, then write the rounded number.
Curated OER
Pie Charts
In this math activity, middle schoolers complete the work in order to chart the data into the pie graph. The picture is used for statistical analysis.
Curated OER
Function Machines
In this math worksheet, students use function machines to complete an x/y T chart. Students convert between Celsius and Fahrenheit temperatures using a function machine.
Curated OER
Woodland Math Facts
In this Woodland math facts worksheet, students study and examine woodland weights of trees and shrubs, explore invertebrates and draw a bar chart to chart their findings.
Curated OER
Family TV
In this family TV worksheet, students study, examine and make predictions about several television shows, collect data and then chart their data collected.
Curated OER
Application Problems with Fractions
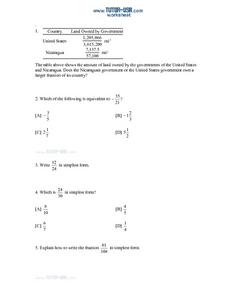
In this math worksheet, students compare fractions from a chart. They simplify six fractions. Students tell the fraction of a day they spend doing various activities. Each fraction is simplified. Three problems are multiple choice problems.
Curated OER
Multiplication Chart
In this math worksheet, students reinforce their multiplication skills by examining a chart of the facts from 1 to 12. Students notice the math patterns and discover multiples.
Curated OER
Challenge Discussion Sheet 4
in this derivative worksheet, students find the derivative for the function w'(t) and tell the meaning of this. They create a sign chart for the derivative of two functions. Students create the graph of the derivative of a function as...
Other popular searches
- Charts and Graphs
- Multiplication Charts
- Maps and Charts
- Place Value Chart
- Tally Charts
- Pie Charts and Graphs
- Pie Chart
- Kwl Chart
- Multiplication Charts to 100
- Reading Charts and Graphs
- Charts
- Prime Numbers 100's Chart


