Curated OER
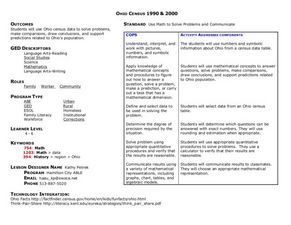
Ohio Census 1990 and 2000
Students begin the lesson plan by examining Census data from the state of Ohio from 1990 and 2000. Using a worksheet, they solve problems using the data and a calculator. They share their responses with the class and discuss what the...
Curated OER
US Airports, Assessment Variation
Determining relationships is all part of algebra and functions. Your mathematicians will decide the type of relationship between airports and population and translate what the slope and y-intercept represent. The problem is multiple...
Curated OER
It's About You
Students explore the U.S. Census and come to understand more about it. In this census lesson, students build reading confidence, explain who is counted in the census, and recognize the connection between census information and community...
Curated OER
It's About You
Students build connections between census information and community decision-making by reading a reader's theater script. In this reader's theater activity, students practice reading fluently and learn about the government. The reader's...
Curated OER
Mapping Districts
Learners become literate in their use of maps. In this 2010 Census lesson plan, students visualize census data on maps, use map keys to read population maps, and explore the concept of population density.
Curated OER
Mapping Districts
Students use maps to learn about the U.S. Census. In this 2010 Census lesson plan, students visualize census data on maps, use map keys to read population maps, and explore the concept of population density.
Curated OER
Numbers Tell a Story
High schoolers connect census data to historical events. For this civics lesson plan, students understand cause and effect, and how they are reflected in census data and analyze census data for social and economic significance.
Curated OER
What's the Point?
Students learn why the census makes a difference. For this U.S. Census lesson plan, students identify who uses census data and how, trace the impact of census data from Census 2000, and present findings in a graphic format.
Curated OER
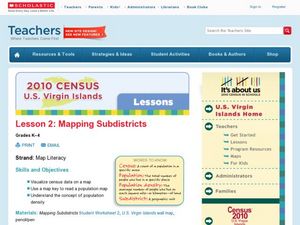
Lesson 2: Mapping Sub-districts
Students learn more about the census. In this mapping sub-districts lesson plan, students visualize census data on a map, use a map key to read a population map, and better understand the concept of population density.
Curated OER
Reshaping the Nation
Students learn why the census makes a difference. In this U.S. Census lesson plan, students learn how to read and use a cartogram while they explore new ways to represent data.
Curated OER
Where We Live
Learners forecast future population growth of the U.S. Virgin Islands. In this U.S. Census lesson plan, students explain the factors that influence population density on the U.S. Virgin Islands, including geography and economic activity.
Curated OER
Mapping Counties
Students practice reading a map. In this mapping lesson, students illustrate a map and compare and contrast the counties based on their population. Students also explore what a census is and read census data on a map. A student...
Curated OER
Getting There
Students practice reading a pictograph. In this data analysis lesson, students collect data and create their own pictograph. A students worksheet is included.


