Curated OER
Bird Beak Adaptation Lab
Middle schoolers investigate bird beaks to determine which physical adaptations are necessary based on the types of food the birds eat. They participate in a lab by visiting multiple stations to determine which beaks are most efficient,...
Curated OER
Introduction to Microsoft Word
Second graders elaborate on the classroom writing practices. They locate the various parts of the keyboard such as, space bar, shift key, delete key, etc. They also type a short piece of writing on a word processor. This is a teacher...
Curated OER
Data Collection and Presentation
Students concentrate on discrete quantiative data. They are shown that the vertical line diagram as a more appropriate way to present discrete quantiative data then bar charts. Students work as a group to help with the interpretation...
Curated OER
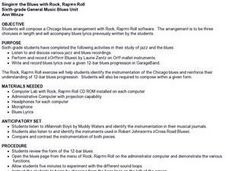
Signin' the Blues with Rock, Rap 'n Roll
Sixth graders listen to recordings and study jazz and the blues music. They identify the instrumentation and explore the 12-bar blues progression. After experimenting with different sound, 6th graders create their own arrangement, with...
Curated OER
Rainforest Data
In this geography worksheet, students use the climate data given to create a temperature line graph and rainfall bar graph for each of three locations given. Then they use an atlas to compare their graphs and draw conclusions about the...
Curated OER
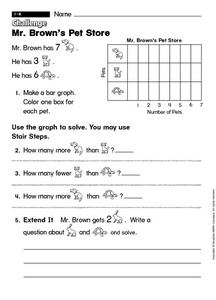
Mr. Brown's Pet Store
In this early childhood problem solving worksheet, students make a bar graph with the provided information and then use the graph to solve 4 problems.
Curated OER
Pets are for Life
Learners research the life spans of several animals and create bar graphs comparing this data. Students, as a class, discuss the long term commitment of owning a pet. Learners imagine how their lives would be different if they had a pet...
Curated OER
Destination of Slaves in 1800
In this slave trade worksheet, learners use the provided Atlantic Slave Trade statistics to create a pie chart and a bar graph. Students also respond to 4 short answer questions.
Curated OER
Analyzing Graphs and Data
Students collect and analyze data. In this statistics lesson, students graph their data and make inferences from the collected data. They display their data using graphs, bar graphs, circles graphs and Venn diagrams.
Curated OER
Making soap you can use
Those textbook experiments are no good. Using this simple method you can make a real bar of soap. It's
Curated OER
Landforms By Hand: Geography, Map Skills
Students experiment with landform vocabulary by using their own hands and a bar of soap as media.
Curated OER
Get the Picture with Graphs
Fifth graders examine line, bar and circle graphs in the newspaper and on the Internet. They complete sketches of graphs with an emphasis on selecting the best model to depict the data collected.
Curated OER
Graphing Made Easy
Fourth graders discover the appropriate way to construct and analyze bar, line, picto, and circle graphs. They set up frequency tables and perform some statistical analysis (mean, median, and mode) on their data.
Curated OER
Investigating Median, Mode, and Mean
Learners develop strategies to organize data while following teacher demonstration. They calculate the mean, median and mode of a data set while determining the relationships between the numbers. They analyze data from tables and double...
Curated OER
The Top Ten On-The-Job Skills and Attitudes
Students interview people who have a business and have people working for them. They create a bar graph with the results of their survey. They create a chart with the most important skills or attitudes looked for in a potential employee.
Curated OER
Magnetic Mapping
Students draw arrows to show the direction the compass needle is pointing when it is placed around different points of a penny and a bar magnet. Students must then answer questions about the activity on a provided worksheet.
Curated OER
Testing Battery Combinations
Fourth graders examine the required combinations of plates and predict which combination will generate the most and least current and voltage. They use an ammeter and experiment with combinations of their own testing and record each...
Curated OER
Technology Lesson Activity: Fractions
Fifth graders practice using the English measuring system by creating fractions. In this parts of a whole lesson, 5th graders combine math key bars to simulate small parts of a bigger item. Students combine the pieces to create...
Curated OER
Heat: The Transfer of Thermal Energy
In this heat worksheet, students complete experiments with heat and answer short answer questions about the transfer of thermal energy. Students complete 4 questions, one chart, and one bar graph.
Curated OER
Graphs Review
Seventh graders review different types of graphs such as bar graphs, line graphs, box & whisker plots. As a class, they read a story and construct graphs to solve the data in the story. Students play "Graph Jeopardy" which requires...
Curated OER
Elementary Lesson Plan
Learners explore and describe the characteristics of music from the Classical period. They work in groups to compose an eight bar 2 part line utilizing Sibelius and explains their melody line and how it is similar to the Classical period.
Curated OER
Keyboard Skills
Young scholars are exposed to the basics of keyboarding. They use the keys for each hand without moving to the opposite sides of the keyboard. They also identify the enter/return key, the shift key, and the space bar. They recognize...
Curated OER
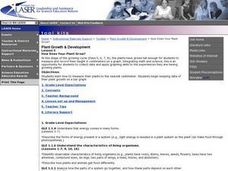
How Does Your Plant Grow?
Young scholars measure and record their height in centimeters on a graph. By integrating math and science, students collect data and apply graphing skills to the experiences they are having growing plants. Finally, young scholars...
Curated OER
How Wet Did It Get?
Students measure the rainfall/snowfall on the playground on a rainy/snowy day with a rain/snow gauge. They draw a bar graph representing the amount of water that fell and observe a satellite image of the clouds and local weather system...
Other popular searches
- Fraction Bars
- Hershey Fraction Bars
- Fractions With Chocolate Bars
- Candy Bars
- Fractions With Hershey Bars
- Math Comparison Bars
- Measurement Bars
- Fractions Fraction Bars
- Fractions and Fraction Bars
- Hersey Bars
- Integer Bars
- Make Fraction Bars


