Hi, what do you want to do?
Curated OER
Making a Cartogram
Students interpret statistical geographic information by creating a cartogram.
Curated OER
Size It Up: Map Skills
Compare information from a US population cartogram and a standard US map. Learners draw conclusions about population density by analyzing census data a population distribution. They discover that census data is used to apportion seats in...
University of California
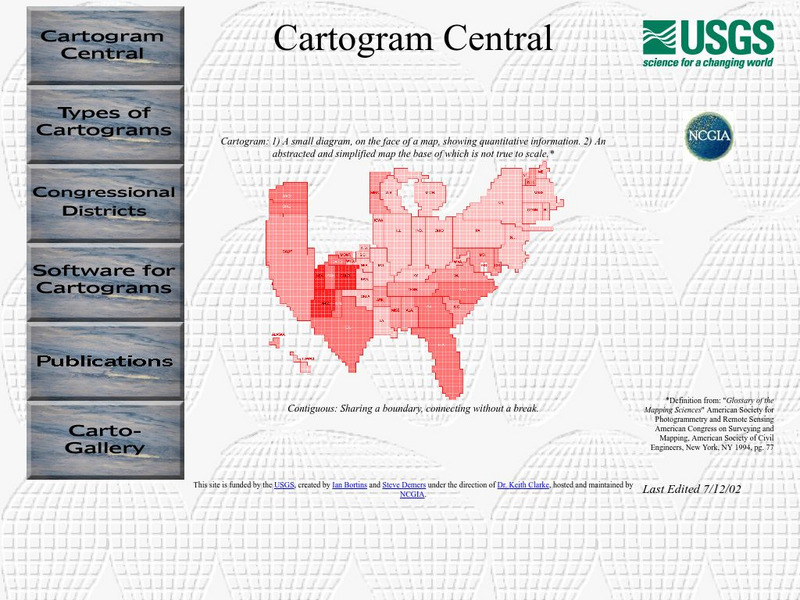
Us Geological Survey: Cartogram Central
The USGS offers detailed information on Types of Cartograms, Congressional Districts, Software for Cartograms, Publications, and a Carto-Gallery.


