Hi, what do you want to do?
Curated OER
Baseball Statistics
Learners take an in depth examine baseball record breakers. They calculate statistics, not just for one year, but over whole careers, to compare some famous players and find who was the best all-time home run hitter.
Curated OER
Box Plots on the TI-83 Calculator
Eighth graders research box plots on the Internet. They gather real life statistics and analyze the collected statistics by making multiple box plots on the TI-83 calculator.
Texas Instruments
Texas Instruments: Comparing Distributions of Univariate Data
Students compare univariate data distributions using statistical concepts like box plots, stem plots, and histograms.
Texas Instruments
Texas Instruments: Measure Up
In this activity, students compare their height with the average height of students in the class. They create histograms to analyze the data, and construct box plots to summarize the height statistics.
PBS
Pbs Teachers: Weather: Temperature Measurement
In this activity, students learn how to convert measures of temperature between the three different scales - Fahrenheit, Celsius and Kelvin. The history and uses of each are very briefly explained as well.
Illustrative Mathematics
Illustrative Mathematics: S Id Haircut Costs
This lesson could be used as an introductory lesson to introduce group comparisons. Being able to use data to compare two groups is an important skill. Students will sketch box plots using the data given about the cost of haircuts for...
Illustrative Mathematics
Illustrative Mathematics: S Id.1,2,3 Speed Trap
A statistically-minded state trooper wondered if the speed distributions are similar for cars traveling northbound and for cars traveling southbound on an isolated stretch of interstate highway. Students will use the data collected by...
National Council of Teachers of Mathematics
Nctm: Illuminations: Advanced Data Grapher
The Advanced Data Grapher can be used to analyze data with box plots, bubble graphs, scatterplots, histograms, and stem-and-leaf plots.
Other
Nearpod: Introduction to Data Representation
In this instructional activity on representation data, students explore how to make dot plots, histograms, and box plots and learn about outliers in a data set.
Richland Community College
Richland College: Ti 82 Histograms / Box Plots
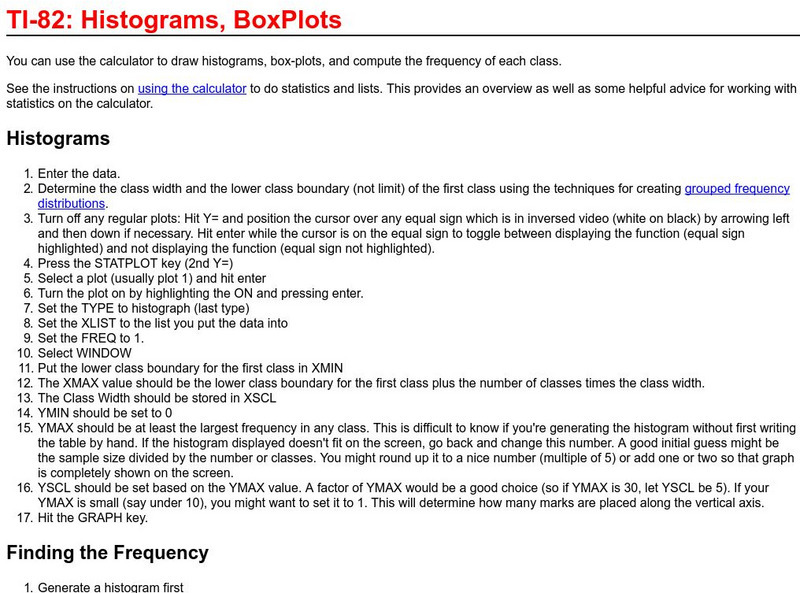
Richland College provides a step-by-step procedure on how to use a TI-82 to construct histograms and box plots and then use this to find frequency distribution.


