Hi, what do you want to do?
ClassFlow
Class Flow: Egg Graphing
[Free Registration/Login Required] This flipchart is a measurement activity to prepare for MAP test it incorporates bar graphing.
ClassFlow
Class Flow: Graphs
[Free Registration/Login Required] This flipchart is a quick review of line, bar, and circle graphs.
ClassFlow
Class Flow: Let's Graph It!
[Free Registration/Login Required] This flipchart has a week of mini lessons where students create bar graphs and pictographs. Students will collect data using tally marks and analyze graphs with discussion questions. Activotes are used...
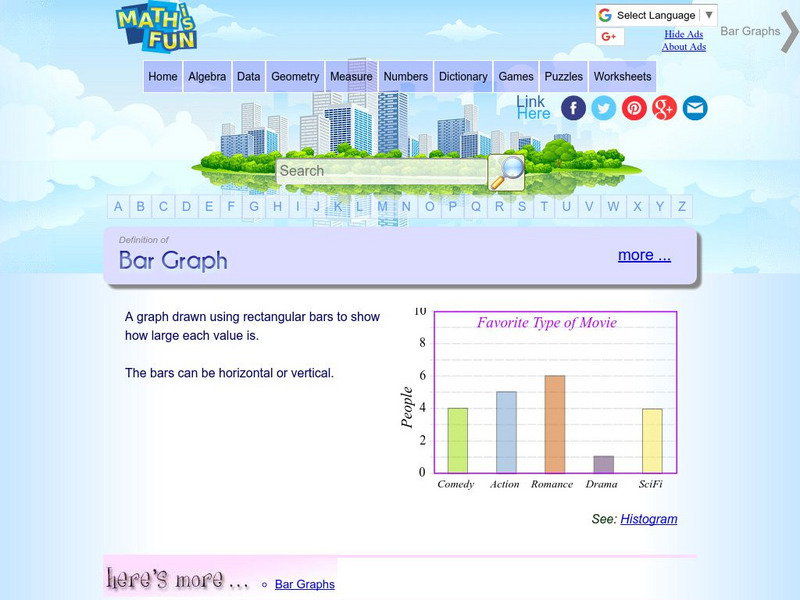
Math Is Fun
Math Is Fun: Definition of Bar Graph
Get the definition for a bar graph. Then, select the link "here's more" and use the interactive graph to display data as a bar graph, line graph or pie chart. The finished graph may be printed.
University of Cambridge
University of Cambridge: Nrich: The Pet Graph
On this one-page website, sharpen your logic and graph reading skills by figuring out which pet goes with each bar on the graph. The solution is available to double check your own solution.
McGraw Hill
Glencoe: Using Graphs to Understand Data Quiz
This is a quiz with five quick questions to check your knowledge of how to use graphs to understand data. It is self-checking.
Varsity Tutors
Varsity Tutors: Hotmath: Practice Problems: Tables and Graphs
Six problems present various aspects of using and making tables and graphs to display statistics. They are given with each step to the solution cleverly revealed one at a time. You can work each step of the problem then click the "View...
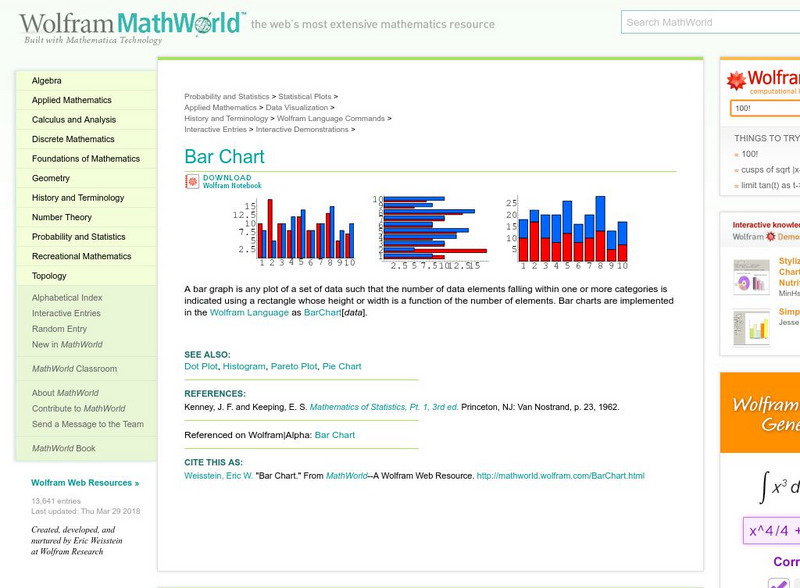
Wolfram Research
Wolfram Math World: Bar Chart
MathWorld offers a definition and example of the math term, "bar chart."
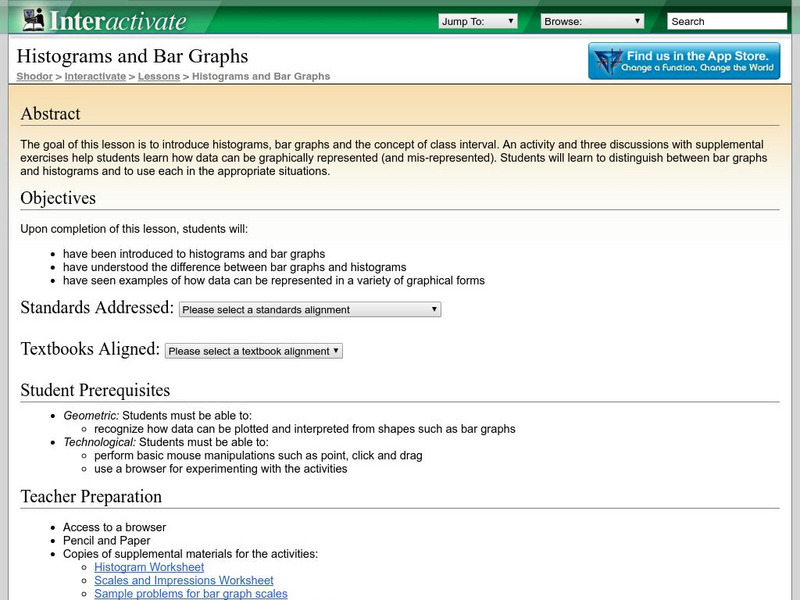
Shodor Education Foundation
Shodor Interactivate: Lesson: Histograms and Bar Graphs
This site provides information on Histograms and Bar Graphs. It includes worksheets, key terms, and links to further information.
University of Illinois
University of Illinois: Rollin' Rollin' Rollin'
This resource is the beginning of a series of pages that demonstrates the diffference between the mean and median of a group of numbers. Uses bar graphs to display the data.
University of Illinois
University of Illinois: Rollin' Rollin' Rollin'
This page from the University of Illinois is the beginning of a series that demonstrates the difference between the mean and median of a group of numbers. The sites use bar graphs to display the data.
Rice University
Rice University: The Hand Squeeze
Students will enjoy this data collection and class analysis experiment involving the time it takes for a hand squeeze to travel around a circle of people. From organizing the activity to collecting the data to making a table and graphing...
Education Place
Houghton Mifflin: Eduplace: Make a Living Bar Graph
Student use simple data to line up in a living bar graph activity when they respond to simple questions in this lesson plan. They physically and visually represent the data. CCSS.Math.Content.3.MD.B.3 Draw a scaled picture graph and a...
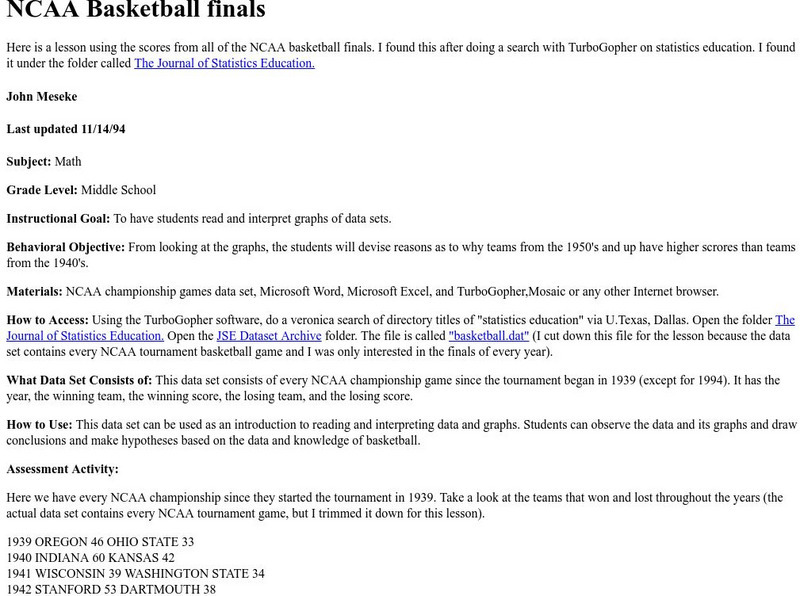
University of Illinois
University of Illinois: Ncaa Basketball Finals Bar Graphs
Site from University of Illinois contains a lesson plan that utilizes the NCAA Basketball Final Scores from 1939-1994. Students are instructed to analyze and interpret data displayed in bar graphs.
Other
Meta Chart: Create a Single Bar Chart
Design and share single bar charts with this web-based tool.
University of Illinois
University of Illinois: Bar Graphs
Two bar graph examples are shown and explained at this website. You can learn what kind of data is best represented using a bar graph.
Science and Mathematics Initiative for Learning Enhancement (SMILE)
Smile: To Classify Beans and Peas (Lesson Plan)
This site provides a lesson plan in which students learn about bar graphs by classifying beans.


