Hi, what do you want to do?
Curated OER
Civic Engagement: Community and Social Action
Explain that today's project is that learners will get groups create a survey to poll their classmates on what they do to stay healthy. The results will then be shown on a bar graph.Students brainstorm ways of keeping healthy and teacher...
Curated OER
What Happens on Average
Fifth graders are introduced to convergence of sequences based on averaging previous terms in the sequence. The power of the "fill-down" function in spreadsheets is exploited. By using various starting numbers, and inferring the limit,...
Curated OER
Not Your Average Average
Students discover that if a distance is traveled in two or more segments at different average speeds, you cannot average the average speeds. Instead the total distance traveled must be divided by the total elapsed time. Students practice...
Curated OER
Thumb Measurement
Students practice measuring using the metric system and millimeters. They measure their thumbs and record their findings. Students record the findings of their classmates and find the average or mean for the two groups.
Curated OER
Prairie Dogs: Finding the Balance
Students study about prairie dogs and determine the mean, median, and mode of a prairie dog tow's population.
Curated OER
How is Your Driver Doing?
Sixth graders explore the concept of averaging of numbers and the function of a spreadsheet. Data is collected, analyzed, and displayed in this instructional activity. The NASCAR race results provides the basis for the collection of data.
Curated OER
Collect, organize and compare different data for the Marine Mammals of the Miami Seaquarium, i.e.: size, weight, diet and habitat and how to calculate average, median, mode and range.
Students collect, organize, and compare different data and develop statistical methods such as: average, median, mode and range as a way for decision making by constructing table
Curated OER
Charting Attendance Rate of Busch Gardens
Sixth graders, in groups, are given different parts of the whole project. They use information from Busch Gardens to explore line graphs, averages, and other math vocabulary.
Curated OER
Central Tendencies and Normal Distribution Curve
Fourth graders are given data (class test scores) to determine central tendencies, and find information needed to construct a normal distribution curve. They become proficient in calculating mode, median and average.
Curated OER
Smallest to Tallest - Where is the Middle?
Third graders measure each other's height and find the mean, median, and mode for the height of students in their class. They line up tallest to shortest and discuss the most appropriate measure of central tendency for the class.
Curated OER
Introduction to Descriptive Statistics
Young scholars follow examples to study basic concepts of statistics. They work independently through the activities.
Curated OER
The Bigger they Are . . .
Students do a variety of data analyses of real-life basketball statistics from the NBA. They chart and graph rebounding, scoring, shot blocking and steals data which are gathered from the newspaper sports section.
Shodor Education Foundation
Shodor Interactivate: Mean, Median, and Mode Discussion
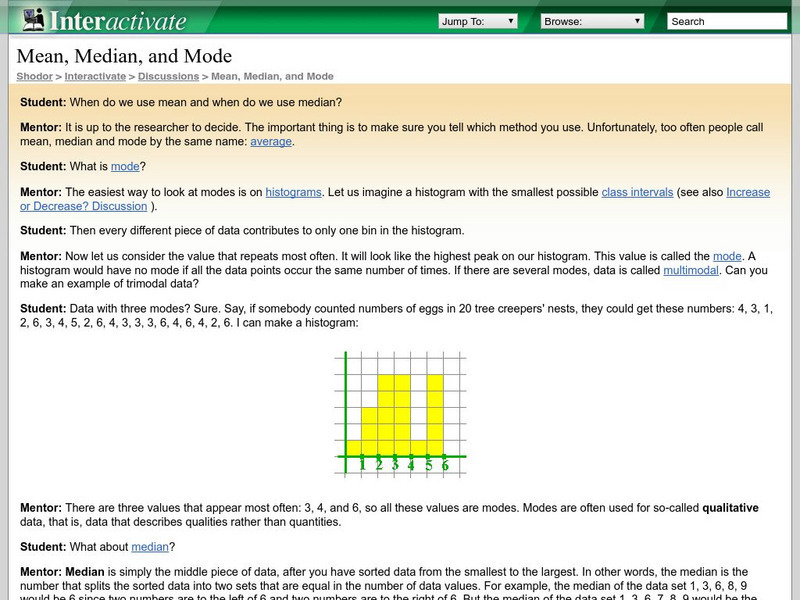
This is a virtual discussion between a mentor and student involving mean, median, and mode. Discusses when each is used and how they are found.
PBS
Pbs Learning Media: Average Practice Time
In this video segment from TV411, figure skaters compute their average daily practice time.
University of Colorado
University of Colorado: Principles of Microeconomics: Production and Costs
High-level site provides a definition and a numerical example for total product. You need to scroll down to the large chart to find this information.
TeachEngineering
Teach Engineering: Means, Modes, and Medians
Students experience data collection, analysis and inquiry in this LEGO MINDSTORMS NXT -based activity. They measure the position of an oscillating platform using a ultrasonic sensor and perform statistical analysis to determine the mean,...
TeachEngineering
Teach Engineering: How High Can a Super Ball Bounce?
Students determine the coefficient of restitution (or the elasticity) for super balls. Working in pairs, they drop balls from a meter height and determine how high they bounce. They measure, record and repeat the process to gather data...
Center for Innovation in Engineering and Science Education, Stevens Institute of Technology
Ciese Collaborative Projects: Down the Drain: How Much Water Do You Use?
How much water do you use everyday? Find out in this engaging investigation, where you compare your water usage with your classmates and other people around the world. An exploration filled with lots of math and science that students are...
Cuemath
Cuemath: Mean, Median and Mode
A comprehensive guide for learning all about mean, median, and mode with definitions, the relation between them, solved examples, and practice questions.
Cuemath
Cuemath: Measures of Central Tendency
A comprehensive guide for learning all about measures of central tendency with definitions of mean, median, and mode, solved examples, and practice questions.
Texas Instruments
Texas Instruments: An Average Lunch?
Students explore the meaning of the average (mean) value for a set of data.
Texas Instruments
Texas Instruments: Parts Is Parts
Students find a sample of a given size with a given mean. In this activity, students show one way 100 families can have a mean of 2.58 children and understand the meaning of the term "average".
Texas Instruments
Texas Instruments: Fractions and Skittles
Students will predict how many of each color will be in one pack of Skittles before they open the package. Once they open the package, they will determine how close their predictions are to the actual amount. Students then will come up...


