Curated OER
Fifty Members of a Group: Average
In this average worksheet, students solve 1 word problem. Students find the average age of 47 people given the average of 50 people and three people's ages who leave the group.
Curated OER
The Air Up There
In this data collection and analysis lesson, students observe and graph the weather conditions during one school week, then calculate the average weather temperature. Extensions are included.
Curated OER
Excel for Beginners
In this Excel lesson plan, young scholars set a formula to check their homework. Students also use clipart, work in groups, and learn to use the tools in the drop-down list.
Curated OER
What is an Average?
In this averages activity, students practice finding the averages of numbers. They use a chart with data to find the average number of wildfires in four states between 1993 and 1996.
Curated OER
Average, Mode, and Median
In this average, mode and median worksheet, students learn how to determine each of these values and practice finding all three. They are given a table of different falcon flight speeds and they calculate the average, mode and median for...
Curated OER
Leveled Problem Solving: Experimental Probability
In this using probability to solve word problems worksheet, students use statistics, averages, and even numbers, to problem solve. Students solve six problems.
Curated OER
Slopes for the Mathematically Inclined
In this slope worksheet, 9th graders solve and complete 6 different problems that include completing charts and applying applications to the real world. First, they use the pictures shown to measure the riser and tread of 3 consecutive...
Curated OER
7th Grade Mathematics Booklet
In this 7th grade mathematics compilation worksheet, 7th graders solve and complete 40 various types of mathematics problems. They determine the measure of various angles and the side-lengths in integers of a square. Students also...
Curated OER
Central Tendency
In this central tendency instructional activity, 8th graders solve 10 different problems that include determining the mean, mode, and median of various situations. First, they prepare a frequency distribution with a class interval for...
Curated OER
Mean, Median, Mode, and Range
In this mean, median, mode, and range worksheet, students define and solve 5 detailed questions that include finding the mean, median, mode, and range of numbers. First, they calculate the mean, median, mode, and range for each set of...
Math Mammoth
Bar Graphs 1
In this bar graph activity, students organize data in a frequency table, then create a bar graph. They find the average of the data. This one-page activity contains two multi-step problems.
Curated OER
Box and Whisker Plots
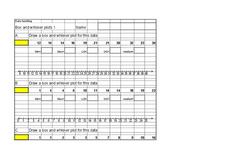
In this math worksheet, students compute the median of sets of numbers. They create box and whisker plots. Students identify the median, upper and lower quartiles, and minimum/maximum amounts. On the last page of this worksheet, students...
Curated OER
Find the Average
In this math instructional activity, students solve five word problems. In each word problem, students solve the problem by finding the average.
Curated OER
Maths at the Mill; A Mathematical Trail Around Sarehole Mill
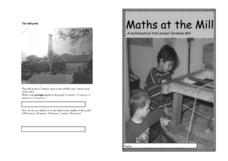
In this math worksheet, students solve math problems based on a trip around the Sarehole Mill. The worksheet includes black and white photographs of the site as well as questions that relate to the mill. Students answer questions about...
Curated OER
What Does Average Look Like?
Fifth graders explore the concepts of range, median, mode, and mean through the use of graphs drawn from models. They use manipulatives to represent data they have collected within their groups, and compare the differences between mode,...
Curated OER
The Average Kid
Young scholars determine the traits they have in common with other students in the class and create visual profiles of the "average" boy and the "average" girl.
Curated OER
Make That Shot!
Students figure out basic percentages by shooting paper balls into a basket, recording results, and calculating individual and team percentages for ten shots.
Curated OER
Math Averages
Students perform different activities to better explain that the word "Average" has 5 different meanings.
Curated OER
Exact or Estimation
Students solve problems using estimation and exact calculations. In this algebra lesson, students use gum balls and thread to create hands on manipulatives to solve problems. They calculate the average of their total data.
Curated OER
Average
In this averages worksheet, students complete word problems about the averages about grocery bills, hospital stays, graphs, and more. Students complete 10 problems.
Curated OER
Assessing the quality of habitat for Monarch Butterflies
Students use different sampling methods to determine the population size and appropriate space for monarch butterflies. For this averages lesson plan, students complete word problems where they can accurately estimate the size of an...
Curated OER
Find the Mean #6
In this find the mean #6 worksheet, 5th graders find the mean for 6 sets of numbers and write it in the box.
Curated OER
Does Shape Affect Drag?
Students study drag and how it affects a parachute in the sky. In this parachutes lesson students build models and compare their drag.
Curated OER
Mean and Median
Students define mean and median. In this "average" lesson plan, students calculate the mean and median for a list of given numbers.


