Hi, what do you want to do?
Curated OER
Data Collection and Presentation
Middle and high schoolers collect and analyze data from four different activities. The activities include information about classmates, tallying colors of cars in a parking lot, stem and leaf plots, and making a histogram from...
Curated OER
Smoking Today = Smoking Tomorrow
Examine statistical data to recognize the relationship of statistics to real-world issues. Pupils navigate e-stat using the Internet and find data about social issues. They complete a worksheet with their data and create an anti-smoking...
Curated OER
Fantasy Baseball
Check out this thematic unit, based on the game of baseball. Learners investigate numbers and number relations as they become familiar with some of the basic terminology associated with the game. They focus their attention on actual...
Beacon Learning Center
Line Plots
Introduce line plots, show examples of tables, graphing on a number line, and engage in a class discussion. Share the process by which statistical data is organized and displayed on a number line. Examples and worksheets are included....
Curated OER
Graphs: All About Our Class
Young scholars respond to survey questions, discuss results, brainstorm ways to represent survey information, and create table of class results. They find mean, range, and percentages, and create graph to display results.
Curated OER
How Much Do I Watch TV?
In this television watching worksheet, students determine the amount of television they watch in a week by recording the names and times of the shows. They total the number of hours of watching time. You can use this with upper...
Curated OER
Costa Rica's Sustainable Coffee
Students experiment to see if birds prefer to eat bird seed with additives vs. no additives. For this experimental lesson students test to see if birds notice a difference between additive and no additive food.
Curated OER
A Picture's Worth a Thousand Words
Young scholars analyze the numbers of male vs female administrators and teachers from their school. In this gender equality lesson plan, students use school yearbooks from the 1950's threw present to count how many male vs. female...
Curated OER
Graphing the Past Using Today's Technology
Eighth graders research statistical data regarding their current social studies unit. They write questions about the measures of central tendency, collect and analyze the data, insert the data into a spreadsheet, and generate graphs.
Curated OER
Data Collection
Students investigate qualitative and quantitative data. In this statistics lesson, students gather data on heights and weights of people and graph the distribution. Students discuss the differences between qualitative and quantitative data.
Curated OER
Be the Kiwi: Gender Roles
Students take a look at gender roles in New Zealand. In this global issues lesson, students analyze statistics that reveal the divide between men and women employees in the country.
Curated OER
Math for Fourth Grade: Statistical Charts
In this math for fourth grade statistical charts worksheet, 4th graders answer 7 multiple choice questions in standardized test format about data, charts and graphs.
Curated OER
My Peanut Butter is Better Than Yours!
Students explore the concept of statistical data. In this statistical data lesson, students read an article about the dangers of peanut butter to those who are allergic. Students perform a taste test of two different brands of peanut...
Curated OER
Statistically Lyrical
Students examine and discuss the writing of ratios as fractions and where they can be found in the real world. They complete worksheets and a questionnaire, and calculate the mean, median, and mode scores for the class.
University of Texas at Austin
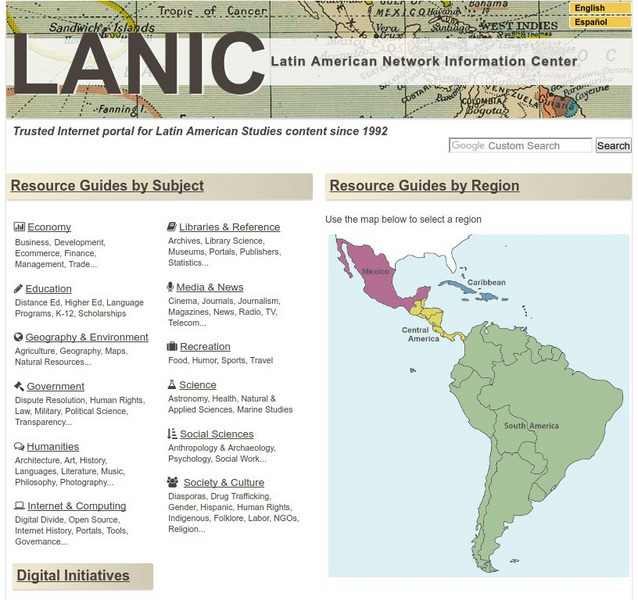
Lanic: Latin American Network Information Center
Vast network of information from and about Latin America is provided. Major topic headings include countries, economy, education, government, humanities, science, social sciences, society and culture, recreation, media and communication,...
Rice University
Hyper Stat Online Statistics Textbook
Many people cringe at the idea of studying statistics, but it doesn't have to be impossible! David M. Lane, Associate Professor of Psychology, Statistics, and Management at Rice University, offers a large collection of resources for the...
Biblioteca Virtual Miguel de Cervantes
Biblioteca Virtual Miguel De Cervantes: Paraguay
This resource site in Spanish for the country of Paraguay. The flag and a general map of the country are included. Of particular interest is the statistical data available on land size, climate, population, life expectancy, infant...
Biblioteca Virtual Miguel de Cervantes
Biblioteca Virtual Miguel De Cervantes: El Salvador
This resource site in Spanish for the country of El Salvador. The flag and a general map of the country are included. Of particular interest is the statistical data available on land size, climate, population, life expectancy, infant...
Biblioteca Virtual Miguel de Cervantes
Biblioteca Virtual Miguel De Cervantes: Costa Rica
This resource site in Spanish for the country of Costa Rica. The flag and a general map of the country are included. Of particular interest is the statistical data available on land size, climate, population, life expectancy, infant...
Biblioteca Virtual Miguel de Cervantes
Biblioteca Virtual Miguel De Cervantes: Colombia
This resource is on the country of Colombia. The flag and a general map of the country are included. Of particular interest is the statistical data available on land size, climate, population, life expectancy, infant mortality rate, and...
Biblioteca Virtual Miguel de Cervantes
Biblioteca Virtual Miguel De Cervantes: Espana
This resource site in Spanish for the country of Spain. The flag and a general map of the country are included. Of particular interest is the statistical data available on land size, climate, population, life expectancy, infant mortality...
Biblioteca Virtual Miguel de Cervantes
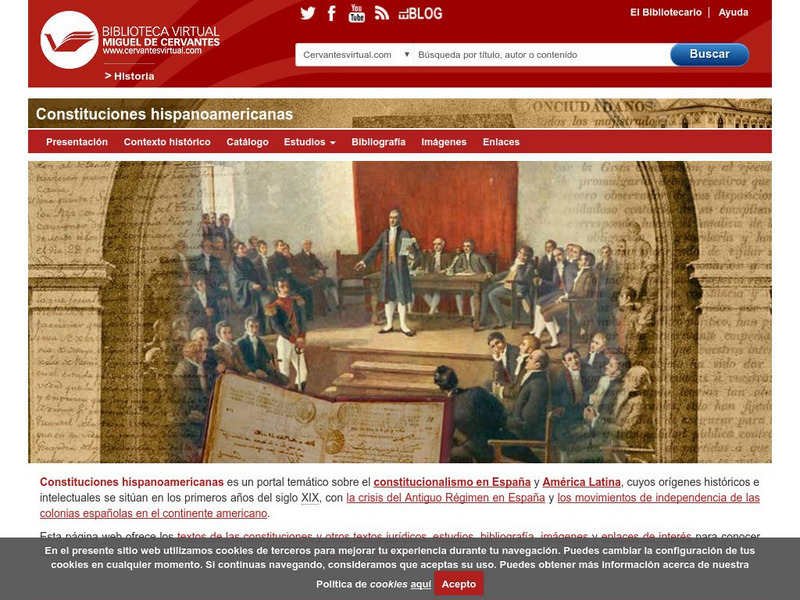
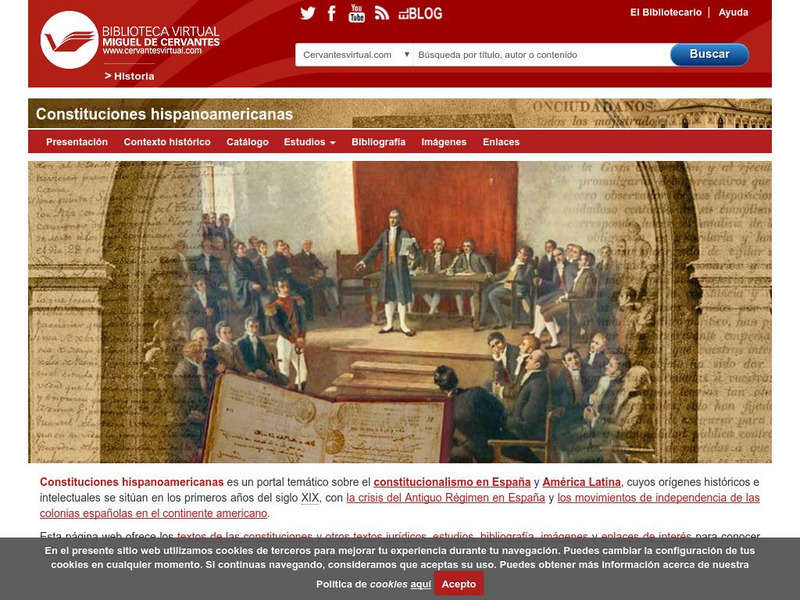
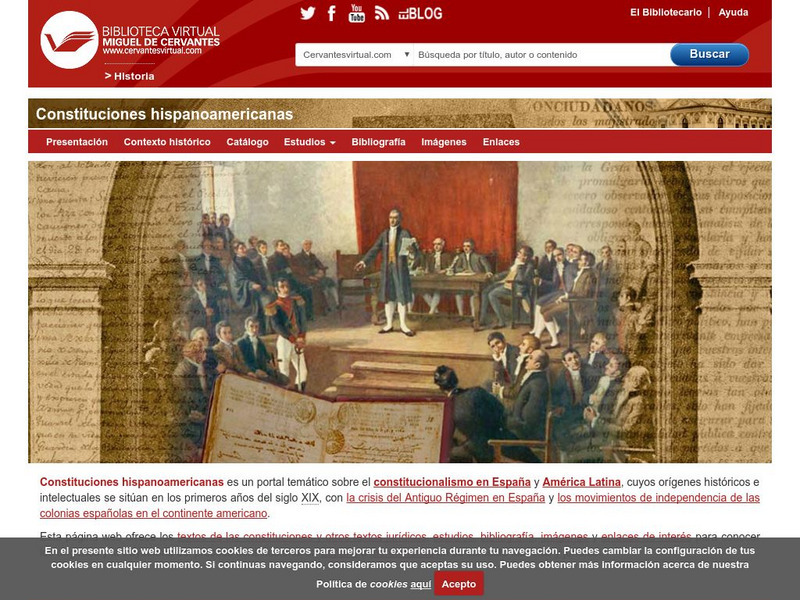
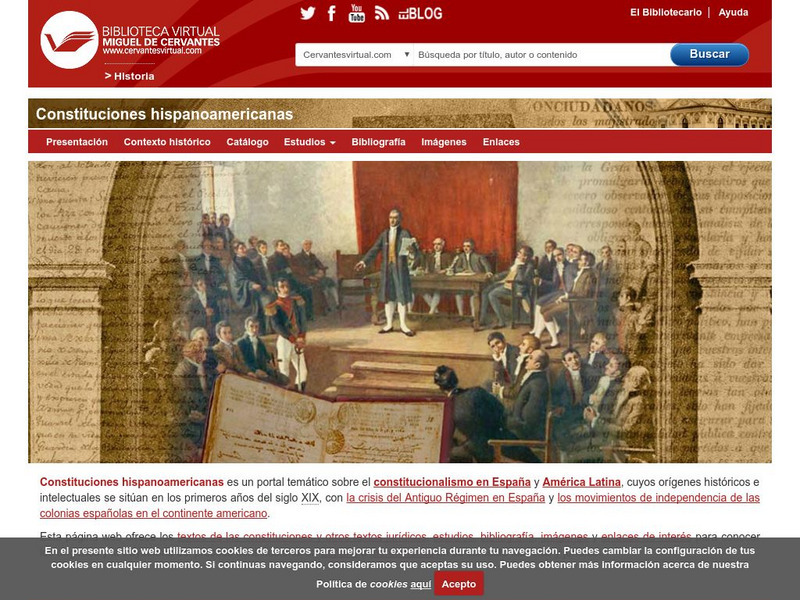
Constituciones Hispanoamericanas
Fascinating comparison of Spanish-speaking countries. Includes the flag and a general map of each country. Statistical data is provided for each country. Constitutional and government information is available for each country.
Annenberg Foundation
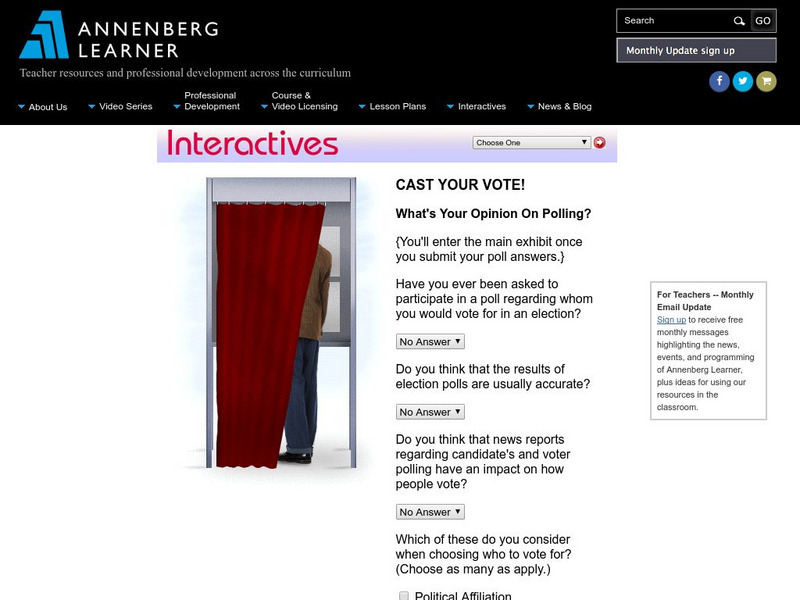
Annenberg Learner: Interactives: Cast Your Vote!
Upper elementary, middle, and high school students can use this exhibit to get an understanding of how polls and elections are conducted. The discussion includes random samples, margins of error, and other concepts related to statistics.
National Council of Teachers of Mathematics
The Math Forum: Exploring Ocean Data Lesson Plan
Find "oceans of data" for students of all ages. NCTM, California, and Philadelphia standards are listed for each grade level along with lesson plans and other website resources.


