Curated OER
Simple Bar Graphs Using Excel
Pupils create original survey questions, and develop a bar graph of the data on paper. They input the survey data using two variables onto an Excel bar graph spreadsheet.
Curated OER
Fabulous Fossils
Seventh graders investigate how fossils are formed and discuss how scientists determine the appearance of ancient plants and animals. They make fossils of everyday objects for others to identify. They make spreadsheets to display fossil...
Curated OER
Graphing Climate Information
Seventh graders plot the data for the average monthly precipitation for three cities. They make a graph using a spreadsheet.
Curated OER
Using a spreadsheet and the Internet to learn about stock market performance
Students record the progress weekly of a business of their choice on the stock market, graph those results, research and report on current news and how it pertains to the companies recent performance.
Curated OER
ICT Activity 17
Eighth graders use a spreadsheet for the first time. They work on a selected environmental issues as their theme. Students prepare costs or income for an event that raises money for an environmental issue. They use the costs and income...
Curated OER
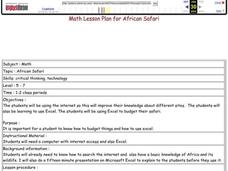
African Safari
Students create an Excel spreadsheet that show a budget for a trip to Africa to see wildlife. In small groups, they complete internet research to determine the countries and sites to visit then calculate the costs involved for the trip....
Curated OER
Skittles Candy Count
Students study how to use formulas, edit the spreadsheet, and create and edit charts. They add data to a spreadsheet, format it, add a chart and format it. They count the number of each color of Skittles and record it onto their Candy...
Curated OER
Spreadsheets - WP9/Quattro Pro
Learners discover spreadsheet applications using Quattro Pro. They demonstrate basic knowledge and application of hardware, software, and Internet use. They recognize and appreciate the value of recording keeping, data input and data...
Curated OER
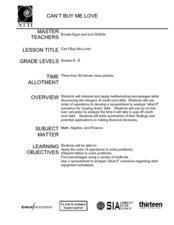
Cannot Buy Me Love
Pupils investigate the concepts that are related to finance and how it is used in the world. They take part in activities that are focused around the use of a spreadsheet while using a T-chart to simulate a ledger of credits and debits.
Curated OER
Introduction to Computing and Project Development
Pupils use a computer and math to complete a science project. They review a brief history of computers as well as information on different operating formats will be included. In addition, students complete an overview of the hardware...
Curated OER
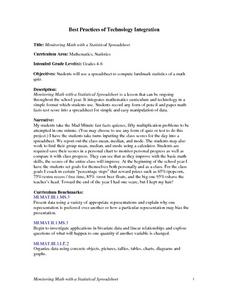
Monitoring Math with a Statistical Spreadsheet
Learners use a spreadsheet to compute landmark statistics of a math
quiz. This instructional activity can be ongoing throughout the school year and it integrates mathematics curriculum and technology in a simple format for student use.
Curated OER
What About That Jazz?
Students, with the help of the NBA Utah Jazz website, formulate how to use a database. In addition, they access how to copy and paste, and prepare a spreadsheet for later use. Students apply productivity/multimedia tools and peripherals...
Curated OER
Who Built It?
Seventh graders study the difference between architectural detail from the Romanesque and Gothic eras. The class participates in discussion on are in different eras. They predict what picture belongs in what era.
Curated OER
Trends in Precipitation
Eighth graders study about precipitation and graph the information. They look for patterns in a scatter graph and make inferences based on what they see. They need to see a relationship between location and the amount of precipitation.
Curated OER
Your Just Desserts
Students write letters to town officials and local businesses asking for favorite dessert recipes. They tabulate their responses in a spreadsheet. Students turn their survey results into colorful graphs.
Curated OER
How Do You Spend Your Time?
Pupils keep records and determine how much time they spend on certain activities. They insert the data into a spreadsheet. Students graphically display data in a bar graph and a circle graph.
Curated OER
Technology Integration Lesson Plan: Civil War Spreadsheet
Eighth graders discuss and analyze Civil War data, manually graph data on handout, work with partners to enter data into spreadsheets, and create charts on spreadsheet for each data set.
Curated OER
Bones and Math
students identify and explore the connection between math and the bones of the human body. Students collect data about bones from their classmates and from adults, apply formulas that relate this data to a person's height, and organize...
Curated OER
Society, Cyberspace and the Future
Students locate information on the rapid growth of world population and consumption needs through the use of Internet, Cd-ROMs, laser dics and other media. They use spreadsheet to present data gathered on world population growth between...
Curated OER
Rouge River Data
Students participate in using Excel sofware in order to create graphs. They create the graphs using data that they gathered during the Rouge River Field Trip they attended. The produce bar graphs from the excel spreadsheets.
Curated OER
Creating a Bar Graph Using a Spreadsheet: Dice Rolling Probabilities
Tenth graders explore the concept of spreadsheets. They create a simple spreadsheet and chart from given data. Students perform basic formatting procedures on their chart. They use spreadsheet functions to perform calculations.
Curated OER
Technology - Data Collection
Students collect and analyze data from the United States Census Bureau. Using spreadsheet technology, students explore their results and make preductions about income groups. Students compute the mean, median and mode. They create...
Curated OER
Comuter Technology-Applying Spreadsheet Information
Students create spreadsheets and practice sorting within the spreadsheet with three different activities. Students manipulate different materials such as addresses, real estate sales, and athletic participation numbers.
Curated OER
Volcano Spreadsheet and Graph
Fourth graders find the height of selected volcanoes and convert their measurements to feet. Students interpret information from a graph. They also write math questions that require the use of a class created graph. Students use a...


