Hi, what do you want to do?
Curated OER
Cruising the Internet
Students identify the parts of an engine using a graph. In this statistics lesson, students make a graph from their collected data. They calculate the volume of a cylinder using a line of regression and a scatter plot.
Curated OER
Line of Best Fit
Students explore the concept of linear regression. For this linear regression lesson, students do a Barbie bungee activity where they collect linear data. Students plot their data using a scatter plot. Students determine a line of best...
Curated OER
Correlation and Regression
In this statistics workshop students find the value of linear correlation coefficients in three situations. Students find equations of the regression lines for 4 problems.
Texas Instruments
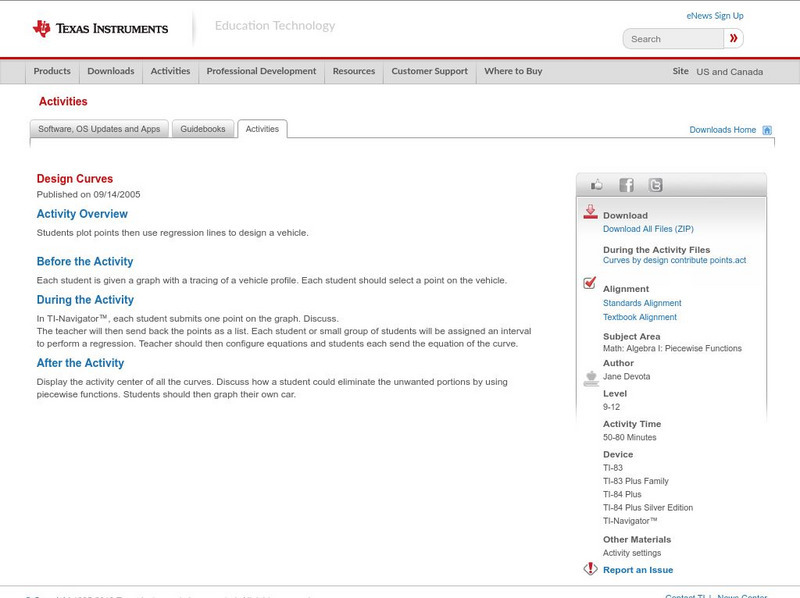
Texas Instruments: Design Curves
Students plot points then use regression lines to design a vehicle.
McGraw Hill
Glencoe Mathematics: Online Study Tools: Self Check Quiz on Linear Functions
The online assessment demonstrates knowledge of advanced mathematical concepts in Algebra II. The questions test students on linear functions. Topics include modeling real-world data with linear functions, scatterplots, and regression...
Illustrative Mathematics
Illustrative Mathematics: S Id.7 Used Subaru Foresters
Jane wants to sell her Subaru Forester and does research online to find other cars for sale in her area. She examines the scatterplot of price versus age and determines that a linear model is appropriate. Answer a variety of questions...
Illustrative Mathematics
Illustrative Mathematics: S Id.6a,7 Olympic Men's 100 Meter Dash
This task asks students to identify when two quantitative variables show evidence of a linear association and to describe the strength and direction of that association. Students will use a scatterplot showing the finishing times for the...


