Curated OER
Empirical Rule Practice Problems
Using the empirical rule for a normal distribution, young statisticians determine the percent of adult women with given heights and weights. They find the percentile rank of a woman of a stated height and find the area under a curve.
Curated OER
AP: Chapter 14: Mendel and the Gene Idea
A survey of Mendelian genetics is presented through this handout. Biology prodigies answer questions about the Law of Segregation, phenotypic ratios, and dominance. They define genetics vocabulary terms and describe various genetic...
Curated OER
Explorations for the Area Probability Applet
Math whizzes use the area probability applet to manipulate the size of the circle and the rectangle to explore the probability that a point in the rectangle is also in the circle.
Curated OER
Probability and Applications of Simulations
Middle schoolers apply properties of probability to the real world. In this probability lesson, learners simulate the construction of empirical distribution. They collect and analyze data using central tendencies.
Curated OER
Probability - Explore and Tabulate
Upper elementary and middle schoolers explore the concept of probability. In this probability lesson, pupils flip coins and draw chips out of a bag to determine the likelihood of a particular outcome. They perform the experiments with...
Curated OER
Probability - Worksheet
Middle schoolers solve and complete four various types of problems. First, they list all the possible orders completed. Then, pupilscomplete the table and show all the outcomes of throwing a coin and spinning a spinner. They also use a...
Curated OER
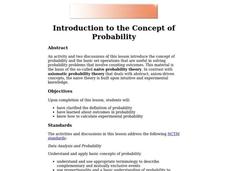
Introduction to the Concept of Probability
Middle and high schoolers have a clarified definition of probability, they explore about outcomes in probability and how to calculate experimental probability. They use computers to learn about probability.
Curated OER
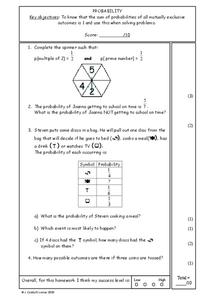
Probability
Middle schoolers explore independent probability. They identify mutually exclusive outcomes. This two-page worksheet contains four multi-step problems.
Curated OER
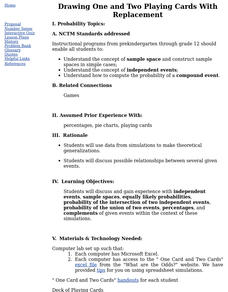
Drawing One and Two Playing Cards With Replacement
Math whizzes use data from simulations to make theoretical generalizations and discuss possible relationships between several given events. They use a simple card game to generate data to be analyzed.
Curated OER
Calculate Probability as a Fraction
Seventh graders solve 10 different problems that include determining the probability of various events described. First, they determine the probability that a marble drawn from a bad will be a specified color. Then, everyone determines a...
Curated OER
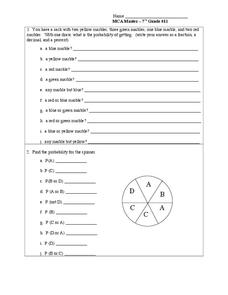
Probability
Seventh graders solve and complete 2 different problems that include a number of other possibilities. First, they draw a marble as stated for each out of a sack of marbles and determine the probability of getting that particular marble....
Curated OER
Investigation - How Tall is the Average Sixth Grader?
Learners will measure each other and record the data in inches. They will use a stem and leaf plot to display data and figure out the average height of the students in a class. The other statistical data will be collected like the mode...
Curated OER
"Lucky Charms": Interpreting Data and Making Predictions
Seventh graders determine if a "lucky charm" will increase their chances of winning a game. Students calculate the experimental probability of each player in a game. They observe and collect data from each activity. Students compare the...
Curated OER
Probability Experiment Simulation: Design and Data Analysis Using a Graphing Calculator
Seventh graders simulate probability experiments. Using a graphing calculator, 7th graders design, conduct, and draw conclusions from simulations or probability experiments. Students construct frequency tables and compare the...
Curated OER
Statistics with M&Ms
Seventh graders explore estimation, measurement, and probability. Students conduct surveys and create charts & graphs. They study the history of chocolate. Students design their own magazine advertisement or create a script for a...
Florida Center for Instructional Technology
Integrating Mathematics into Literature
You class will read Cucumber Soup by Vickie Leigh Krudwig as an anticipatory set for this activity on ratios. They make models of the insects in the story and then use them as a source of data for this ratio and proportion activity. This...
Curated OER
Fire!, Probability, and Chaos
Upper elementary and middle schoolers work with the concept of probability. They are introduced to the concept of chaos. Learners graph and analyze using a line plot, work with mean, and are introduced to the concept of variance.
Curated OER
Non Calculator Math Quiz
Here is a quiz which does not allow calculators. Kids solve a variety of problems that range from addition and subtraction of decimal numbers to probability and perimeter. There are 24 problems to solve. As stated on the resource, this...
Curated OER
Probability using M & M's
Using M & M's candies, young statisticians predict the color distribution in a packet of candies and test their predictions against their group and the larger class. A review of converting between fractions, decimals, and percents...
Curated OER
8th Grade Math Worksheet
In this linear equations worksheet, 8th graders solve 10 different problems that include various types of linear equations. First, they write the distance between Venus and the Sun in scientific notation. Then, students determine the...
Curated OER
Language of Probability
Enhance your next lesson on probability with a text rich presentation intended to teach the language associated with probability. The use of decimals, fractions, and percents are discussed as well are the terms, likely, unlikely, and...
Curated OER
Graphs: All About Our Class
Students respond to survey questions, discuss results, brainstorm ways to represent survey information, and create table of class results. They find mean, range, and percentages, and create graph to display results.
Curated OER
Statistics and Shopping
Explore how statistics are used in everyday life. Your soon-to-be savvy consumers use the Internet to find consumer-related statistical information and learn to make wise consumer decisions. Includes links to a practice sheet about data...
Curated OER
Calculating Probabilities: Introduction
Introduce your class to a sure-fire method for calculating probabilities. The method is described alongside several examples, then put into practice with a series of probability questions for the class to solve. This would be a great...


