Hi, what do you want to do?
Curated OER
Bouncy Ball Collections
In this data table worksheet, students examine a table regarding bouncy ball data and respond to 4 questions regarding the data.
Curated OER
Analyze a Survey
In this analyzing data worksheet, students read a tally chart regarding survey information and respond to 4 analytical questions regarding the data.
Curated OER
Penny Drive
In this analyzing data worksheet, students examine information regarding a penny drive and respond to 6 short answer questions pertaining to the data.
Curated OER
Cloud Types
Learners examine cloud types. In this cloud lesson, students identify cloud types, observe clouds and collect data, and analyze data to identify the most common cloud they observe overhead during the course of a month.
Curated OER
Data Collection - Primary Poster
Students explore the concept of collecting, analyzing, and graphing data. In this collecting, analyzing, and graphing data lesson, students create a survey about a topic of interest. Students poll their classmates, analyze, and graph...
Curated OER
Questionnaires and Analysis
In this questionnaires and analysis learning exercise, students design a questionnaire and then select a sample. They organize and analyze data. This four-page learning exercise contains 1 multi-step problem. Explanations and examples...
Curated OER
Algebra- Cell Phone Plans
Students analyze graphs to compare cell phone plans. In this algebra lesson, students work together to analyze phone plans and report the best phone plan. Students develop tables and graphs.
Curated OER
Calendar Clues Worksheet
In this birthday calendar worksheet, students look closely at a classroom birthday calendar and use the graphic organizer on the worksheet to analyze the data. Then students use the data to write a newspaper story, poem , or story.
Curated OER
Skittle Graphing (Lesson Plan)
Students discuss the uses of graphs. They use color candies to count and sort before designing graphs. They label the graph papers with appropriate titles and candy colors. They complete the graph bars, and discuss the results with a...
Curated OER
Where We Live
Young scholars make a 'where we live' chart to find what's common and unique about where they live. In this living analysis lesson, students complete a chart about where they live.
Curated OER
Range and Measures of Central Tendency
Third graders take notes on a PowerPoint presentation featuring calculating and analyzing data. They practice skills highlighted in the presentation and create a table in Microsoft Excel showing data analysis.
Curated OER
Energy Conservation (Middle, Mathematics)
Students take turns reading the electric meter six times a day at regularly scheduled intervals. They figure out the amount of electricity used and then determine the total cost of electricity for the week.
US Department of Education
Helping Your Child Learn Math: Math in the Home
An excellent compilation of activities that engage parents and children in math explorations at home. Detailed lessons covering a wide range of math topics such as fractions, measurements, money, data collection, and math in newspapers....
Other
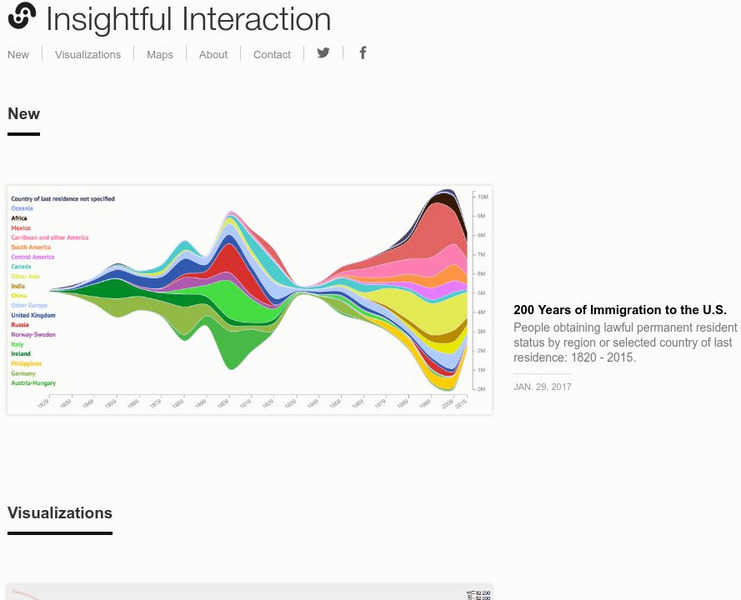
Insightful Interaction: Visualizations
A collection of interactive visualizations that were produced through analysis of economic, political, and market research data. Topics are diverse, e.g., military spending and trade, immigration, consumer spending, crime, unemployment,...
McGraw Hill
Glencoe: Self Check Quizzes 1 Analyzing Graphs
Use Glencoe's randomly generated self-checking quiz to test your knowledge of how to analyze graphs. Each question has a "Hint" link to help. Choose the correct answer for each problem. At the bottom of the page click the "Check It"...
REMC Association of Michigan
Remc Association of Michigan: 21 Things4 Students: 13. Dig the Data
This tutorial contains ten quests. You will learn to create spreadsheets and charts, use formulas, and make decisions based on data. The first five quests has students plan a party and in the last five, they collect and analyze data for...
US Census Bureau
Us Census: Percentage of People Who Walk to Work in Cities and Population Size
Using census data, students will create box plots to make inferences about the percentages of people who walk to work in cities of different population sizes (small, medium, and large). Students will use these findings to write a short...
Other
The Actuarial Foundation: Play Ball! [Pdf]
Students will understand and apply concepts of data collection, representation, and analysis in a sports context.
Scholastic
Scholastic: Cultivating Data
Students will understand key concepts of data analysis and their graphic representations. Students will construct and interpret data tables, line plots, box-and-whisker plots and stem-and-leaf plots, scatterplots with line of best fit,...
Houghton Mifflin Harcourt
Holt, Rinehart and Winston: Homework Help Independent Practice: Misleading Graphs and Statistics
Get independent practice working with misleading graphs and statistics. Each incorrect response gets a text box explanation and another try. Correct responses are confirmed.
Houghton Mifflin Harcourt
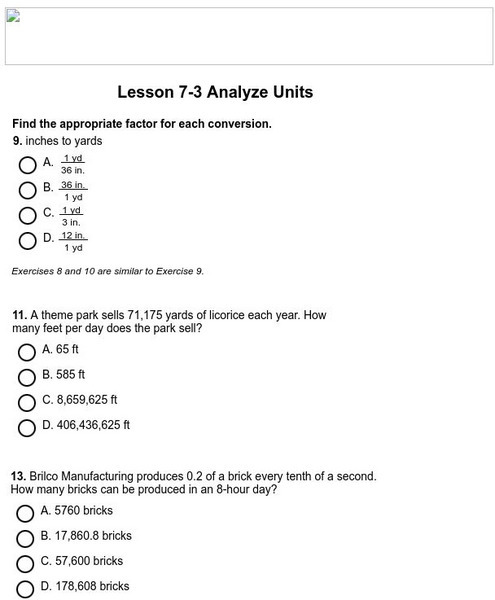
Holt, Rinehart and Winston: Homework Help Independent Practice: Analyze Units
Get independent practice working with analyzing unit rates. Each incorrect response gets a text box explanation and another try. Correct responses are confirmed.
Dartmouth College
Dartmouth College: Mqed: Exercises in Data Analysis
The resource consists of activities that have learners explore data analysis techniques.
University of Regina (Canada)
University of Regina: Math Central: Data Management and Analysis Lessons
A collaboration of elementary level lessons on data management and analysis. Some examples of the topics demonstrated are grids, timelines, and weather.
Texas Instruments
Texas Instruments: Biggest Box
A classic problem looking at maximizing volume by varying the height of a box. Uses graphing calculators to analyze data collected and to model a cubic equation. Look for points that maximize volume while developing a preliminary notion...


