Sophia Learning
Sophia: The Usefulness of Stem and Leaf Plots
This lesson explains why stem-and-leaf plots are useful when representing data. Students can watch a video tutorial to learn the concept.
Loyola University Chicago
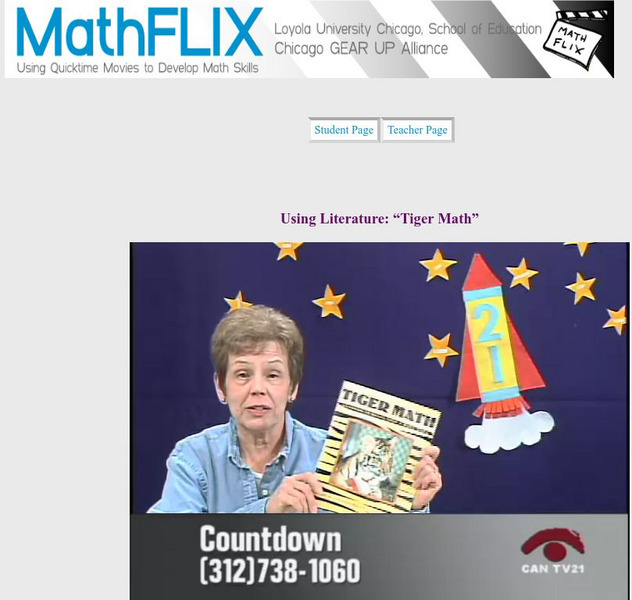
Math Flix: Graphs: Literature "Tiger Math"
This QuickTime movie uses the children's book, "Tiger Math" as a starting point for using graphs to tell a story. As you watch and listen to the teacher and student interact it helps clarify the thinking behind applying this concept.
Sophia Learning
Sophia: Extreme and Mild Outliers
This lesson discusses how mild and extreme outliers are represented on a box plot.
Sophia Learning
Sophia: Extreme and Mild Outliers: Lesson 3
This lesson discusses how mild and extreme outliers are represented on a box plot. This is part of a series of lessons about the parts of a box plot. It is 3 of 3 in the series titled "Extreme and Mild Outliers."
Bozeman Science
Bozeman Science: Beginner's Guide to Graphing Data
Paul Andersen explains how graphs are used to visually display data that is collected in experimentation. He describes five main types of graphs; line graph, scatter plot, bar graph, histogram and pie chart. He describes the important...
Loyola University Chicago
Math Flix: Extended Response: Summer Jobs Create a Table
This QuickTime movie presents an explanation of the solution for a problem that requires an extended response to choose an insurance company based on costs. The teacher and student discuss how to work through it together to find the...
Sophia Learning
Sophia: Line Plots Tutorial
This video lesson introduces line plots as a way of graphing data. Includes several multiple-choice questions to check your understanding. [3:00]


