FuseSchool
What Is Nuclear Fission?
"How does a nuclear reactor provide energy? What causes a nuclear meltdown? And how do we make this safe?
Curated Video
Data Science and Machine Learning with R - Data Import/Export
This video explains how to import and export data in R. This clip is from the chapter "Intermediate R" of the series "Data Science and Machine Learning with R from A-Z Course [Updated for 2021]".This section explains intermediate R.
Curated Video
Advantages of Representing Data on a Histogram
This video discusses the advantages of representing data on a histogram. It explains how histograms group data together in intervals, show symmetry, trends, and gaps, and provide information about the frequency of data within each...
Curated Video
Advantages of Representing Data on a Dot Plot
In this video, the advantages of representing data on a dot plot are explained. The teacher discusses how dot plots provide a quick snapshot of the shape of the data, show individual data points, and accurately represent the distribution...
Khan Academy
Khan Academy: Making Picture Graphs and Line Plots
Watch this video demonstration of how to make picture graphs and line plots. Includes a video, transcript, and question and answer section. [3:08]
Khan Academy
Khan Academy: Solving Problems With Pictographs 2
Sal Khan uses picture graphs to solve word problems. [3:38]
Khan Academy
Khan Academy: Interpreting Picture Graphs: Paint
Lindsay from Khan Academy solves a multi-step word problem involving a picture graph. [1:22]
Loyola University Chicago
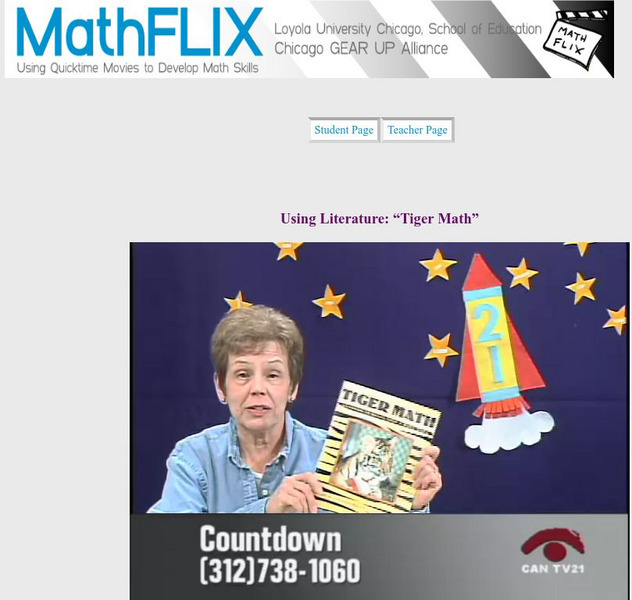
Math Flix: Graphs: Literature "Tiger Math"
This QuickTime movie uses the children's book, "Tiger Math" as a starting point for using graphs to tell a story. As you watch and listen to the teacher and student interact it helps clarify the thinking behind applying this concept.
Loyola University Chicago
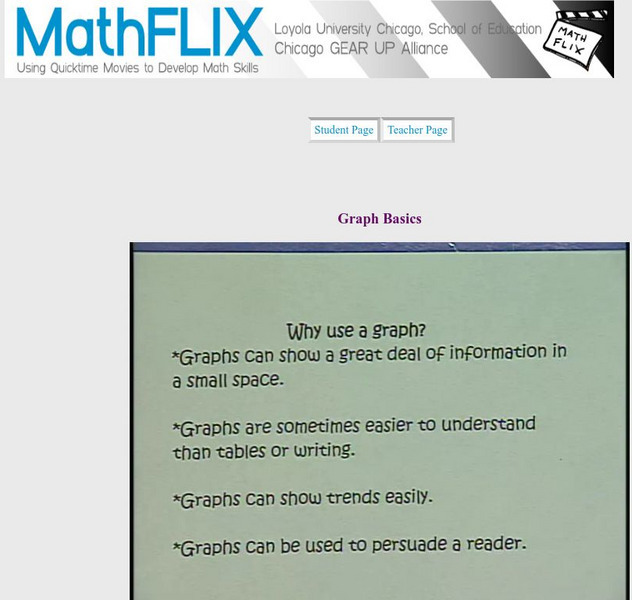
Math Flix: Graphs: Basics
This QuickTime movie reviews basic concepts for graphs. As you watch and listen to the teacher and student interact it helps clarify the thinking behind applying this concept.
Loyola University Chicago
Math Flix: Graphs: Matching Stories to Graphs Part 2
This QuickTime movie provides more opportunities to match stories to graphs. As you watch and listen to the teacher and student interact it helps clarify the thinking behind applying this concept.
Loyola University Chicago
Math Flix: Graphs: Bar Graph Histograms
This QuickTime movie introduces a specific type of bar graph called histograms. As you watch and listen to the teacher and student interact it helps clarify the thinking behind applying this concept.


