Hi, what do you want to do?
Centre for Innovation in Mathematics Teaching
Ten Data Analysis Activities
This thirteen page data analysis worksheet contains a number of interesting problems regarding statistics. The activities cover the concepts of average measurements, standard deviation, box and whisker plots, quartiles, frequency...
Curated OER
Starting With Stats
Statisticians analyze a data set of student IQs by finding measures of central tendency and dispersion such as mean, median, mode, and quartiles. They practice using a graphing calculator to find the values and analyze box plots and...
Curated OER
Box Plots
Young statisticians are introduced to box plots and quartiles. They use an activity and discussion with supplemental exercises to help them explore how data can be graphically represented.
Curated OER
Measures of Central Tendency
In this measures of central tendency worksheet, students solve and complete 6 different problems. First, they count the number of items in each set of data. Then, students determine the mean, median and mode for each. In addition, they...
Curated OER
Statistics
In this statistics worksheet, students solve and complete 6 different problems that include determining various types of statistics. First, they determine the data set where the median value is equal to the mean value. Then, students use...
Curated OER
Measures of Central Tendencies: Quartiles
For this statistics worksheet, students calculate the mean, median, mode, range, lower quartile, and upper quartile for 10 questions and interpret a box and whiskers graph.
Curated OER
Statistics: Quartiles and Percentiles
In this statistics worksheet, students examine a data set and identify the lower and upper quartiles. They determine percentile ranks of given material and compute the median of the data. This one-page worksheet contains ten problems.
Curated OER
Independent Practice 1: Box and Whisker Plot
In this box and whisker plot learning exercise, high schoolers create a box and whisker plot from a given set of data. They identify the lower quartile, upper quartile, the mean, and outliers. This one-page learning exercise contains...
Curated OER
Organizing and Interpreting Data
In this organizing and interpreting data worksheet, students solve and complete 10 different problems related to reading various data tables. First, they complete the 3 charts shown with the correct tally amount, frequency amount, and...
Annenberg Foundation
Annenberg Learner: Learning Math: Min, Max and the Five Number Summary
Explore how to interpret a large set of data by dividing it up into smaller portions in order to answer statistical questions.
Cuemath
Cuemath: How to Find Interquartile Range
A comprehensive guide for exploring the topic of interquartile range by finding answers to questions like what is meant by interquartile range, how to find interquartile range, and what is the formula for interquartile range. Includes...
University of Georgia
University of Georgia: Measures of Variation
Lesson plan introduces and explains how to calculate measures of variation concepts such as range and quartile.
Mangahigh
Mangahigh: Data: Find the Quartiles and Interquartile Range
This site provides students practice with the concept of interquartile range. Students can learn about the topic by completing an interactive tutorial. Students can then take a ten question timed test to practice the skill.
CK-12 Foundation
Ck 12: Statistics: Applications of Box and Whisker Plots Grade 8
[Free Registration/Login may be required to access all resource tools.] Using box-and-whisker plots to understand and interpret data.
CK-12 Foundation
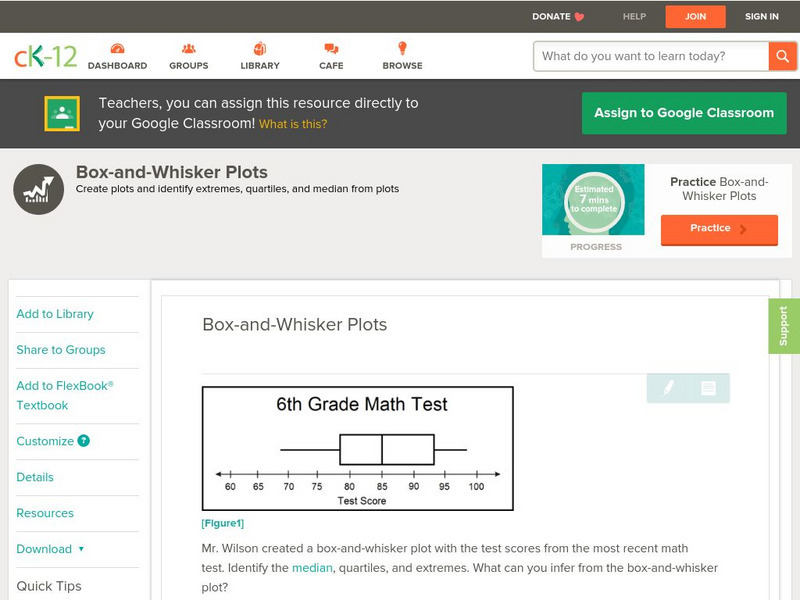
Ck 12: Statistics: Box and Whisker Plots Grade 8
[Free Registration/Login may be required to access all resource tools.] Make Box-and-Whisker Plots to represent data.
CK-12 Foundation
Ck 12: Statistics: Box and Whisker Plots Grade 7
[Free Registration/Login may be required to access all resource tools.] Draw and use box-and-whisker plots to display and organize data.
Khan Academy
Khan Academy: Interpreting Quartiles
Practice understanding the meaning of quartiles of data sets. Students receive immediate feedback and have the opportunity to try questions repeatedly, watch a video or receive hints.
Math Is Fun
Math Is Fun: Quartiles
Explains what quartiles are and some different contexts in which they are used. Includes ten practice questions.
CK-12 Foundation
Ck 12: Statistics: Quartiles
[Free Registration/Login may be required to access all resource tools.] Order a set of data and understand the measures needed for a box-and-whisker plot.
Sophia Learning
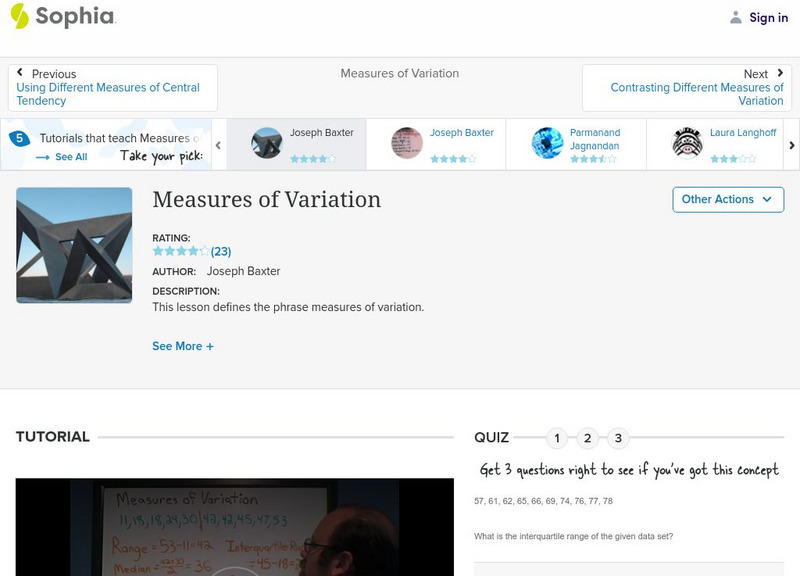
Sophia: Measure of Variation
Explore the measures of variation and check understanding with an assessment.
Shodor Education Foundation
Shodor Interactivate: Lesson: Box Plots
This lesson plan introduces quartiles and box plots. It contains an activity and discussion. Supplemental activities about how learners can represent data graphically are also included.
Oswego City School District
Regents Exam Prep Center: Statistics: Percentiles and Quartiles
Use this site to learn how to divide data into quartiles in this tutorial. You'll need a calculator to do the practice problems. The teacher resource page contains a warm-up exercise for use before a quartile lesson.
CK-12 Foundation
Ck 12: Statistics: Box and Whisker Plots Grade 6
[Free Registration/Login may be required to access all resource tools.] Draw and analyze a box-and-whisker plot.
Purple Math
Purplemath: Quartiles, Boxes, and Whiskers
Explains how to construct a simple box-and-whisker plot, and demonstrates the steps. Discusses quartiles and medians, shows how to find them, and explains how they relate to box-and-whisker plots.


