Hi, what do you want to do?
Curated OER
The Gathering and Analysis of Data
Young mathematicians gather data on a topic, graph it in various forms, interpret the information, and write a summary of the data. They present their data and graphs to the class.
Curated OER
7th Grade Math Circle Graphs
Seventh graders are able to develop (synthesis) pie graphs with the class and on their own. They are told that pie charts are a graphic representation of material that can be given in the form of parts of a whole by using...
Curated OER
Graphing
Students collect data to create different types of graphs-line, pie, and bar graphs. They use StarOffice 6.0 to create graphs.
Curated OER
First Word: Pie
In this word recognition instructional activity, students trace the word pie, write it independently, and identify it in a group of other words.
Curated OER
Pie Puzzle
In this pie puzzle, students identify types of pies. Examples include apple, cherry, and pumpkin. A list of 18 pies is provided to assist students in their search.
Curated OER
Graph Lab
Seventh graders explore bar graphs and pie charts. Given a pack of M&Ms, 7th graders explore the colors, sort the data in a frequency chart and then construct bar graphs and pie charts to categorize the M&Ms by color. Students...
Curated OER
Double-Crusted Pie Lab
Students individually practice the techniques and skills learned in preparing a double crusted pie using fresh, canned or frozen fruit that needs to be thickened with tapioca, flour or cornstarch.
Chase Young, PhD
Dr. Chase Young, Ph D: Reader's Theater Script: The Great Apple Slice Escape [Pdf]
A reader's theater script for Lois Walker's children's book, The Great Apple Slice Escape, is provided on these pages. Eleven (or more) character roles are needed in this activity.
Utah Education Network
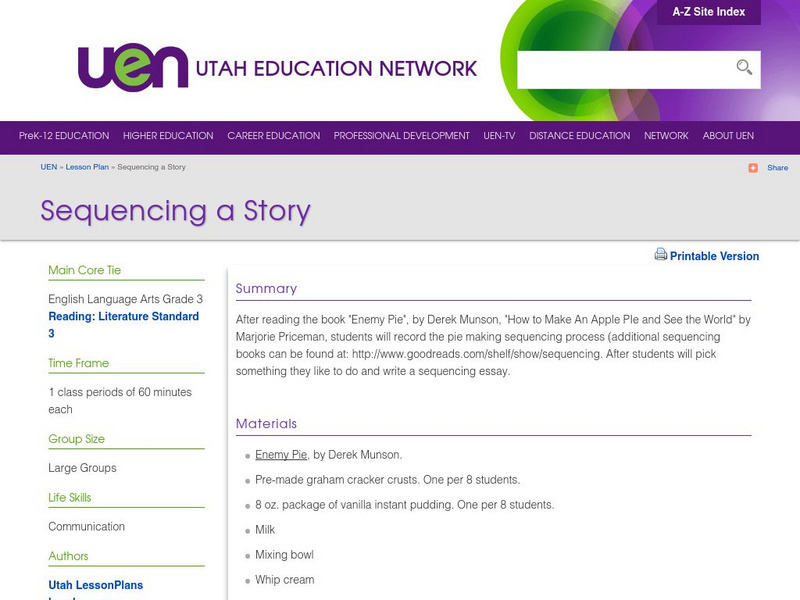
Uen: Sequencing a Story
This single-period lesson reinforces the concept of story sequence. Teachers of this lesson will read aloud Enemy Pie, by Derek Munson, How to Make An Apple Pie and See the World by Marjorie Priceman. Then students will participate in...
Wolfram Research
Wolfram Math World: Archimedes' Recurrence Formula
This page from Mathworld.com presents illustrations and equations involving Archimedes' Recurrence Formula.
ClassFlow
Class Flow: Charts Handling Data
[Free Registration/Login Required] Reading graphs fit together with this engaging, colorful flipchart analyzing pie charts, bar graph, percents, and fractions.
Ducksters
Ducksters: Kids Math: Picture Graphs
Math picture graphs for kids. Pie, line, and bar charts. Learn with problems, examples.


![Dr. Chase Young, Ph D: Reader's Theater Script: The Great Apple Slice Escape [Pdf] Activity Dr. Chase Young, Ph D: Reader's Theater Script: The Great Apple Slice Escape [Pdf] Activity](https://static.lp.lexp.cloud/images/attachment_defaults/resource/large/FPO-knovation.png)


