Hi, what do you want to do?
Curated OER
Exploring the Normal Curve Family
Pupils find different characteristics of the bell curve. In this statistics lesson, students analyze a family for a specific characteristic. They identify the shape, center, spread and area as they analyze the characteristic of the...
Curated OER
Looking Normal
Learners identify the shape of a function. For this statistics lesson, students plot the data collected. They analyze their data for positive, negative or no correlation. They find the line of best fit.
Curated OER
The Bell Curve
Students explore the concept of the bell curve. In this bell curve lesson, students discuss the controversy associated with the bell curve. Students use an applet to explore a normal distribution. Students discuss mean, median, mode,...
Curated OER
Normal Curve Areas
In this normal curve areas activity, students follow 6 steps to compute probability regarding possible sample means using a large sample. First, they label the scale with the mean and corresponding standard deviations. Then, students...
Curated OER
Normal Curve Areas - Population
In this normal curve areas worksheet, students follow 6 steps to compute the probability regarding the values from the population. First, they label x-scale with the mean and corresponding standard deviations and shade the area(s) under...
Curated OER
Normal Curve Areas
In this normal curve areas worksheet, students follow 6 steps to compute the probability regarding the possible sample of proportions using a large sample population. First, they label the Ps-scale with the proportion and corresponding...
Curated OER
The Bell Curve
Students are introduced to the normal distribution and examine the bell curve controversy.
Missouri State University
Missouri State University: Introductory Statistics: T Test: The T Distribution
This discussion of statistical t distributions is presented in notes with examples added as needed.
Missouri State University
Missouri State University: Introductory Statistics: The Normal Curve
Provides a complete discussion of normal curves in statistics. Site is presented in notes with examples added as needed.
Texas Instruments
Texas Instruments: Numb3 Rs: Galton Board
Based off of the hit television show NUMB3RS, this lesson has students find the probability of chips falling into each bin of a Galton Board (also known as a quincunx or Plinko board), and then graphing these data to form a normal curve....
Palomar Community College District
Palomar College: The Normal Curve an Example
A collection of step-by-step worked problems demonstrating how to take a normal curve and determine the probability (area) under it. Hints are provided along the way and the final measures are shown for the user to check.
Oswego City School District
Regents Exam Prep Center: Binomial Probability
The mathematics tutorial investigates binomial probability and the normal curve. The lesson consists of class notes, calculator tips, examples, and practice problems with solutions. The teacher resource includes a z-score chart.
Other
Stat Soft: Statistics Glossary
Dozens of statistical terms are defined and illustrated in this glossary.
Other
West Virginia University: Normal Distribution
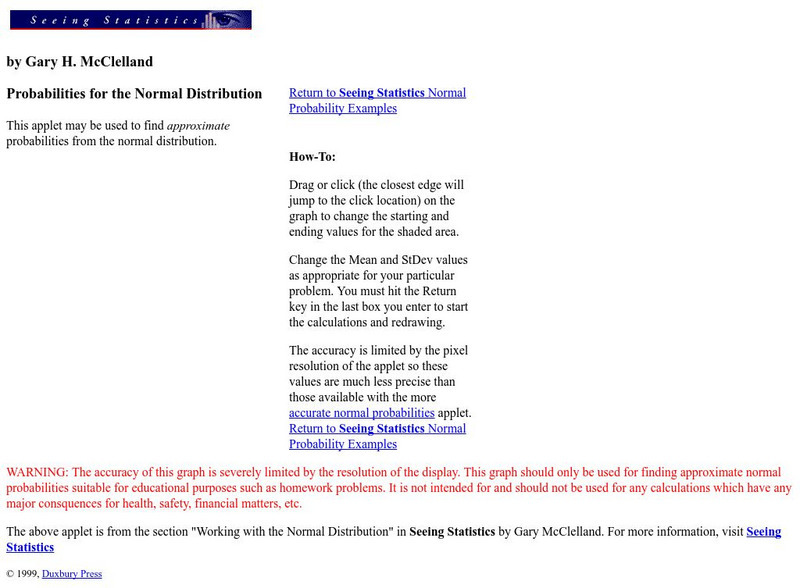
The history of the normal curve and its use in statistics is presented. An Applet is provided for the user to adjust the left and right edges of the probability and see the effect on the area under the curve.
Texas Instruments
Texas Instruments: Normal Distribution
This set contains statistics questions regarding the normal curve, its distribution, and its applications. The student, using the correct calculation, transitions between observed x-values, standard z-scores, and normal curve areas.
University of Colorado
University of Colorado: Normal Probabilities Applet #2
This Applet allows the user to grab and drag the ends of the included region below the standard normal curve to the appropriate places needed. The user directly experiences the connection between the shaded area under the curve and the...
Other
Berrie's Statistics Page: Graph of Normal Distribution
Explanation of the Normal Curve and the importance of the normal distribution
Other
Univ. Of Peru: 3 D Normal Distribution in Virtual Reality
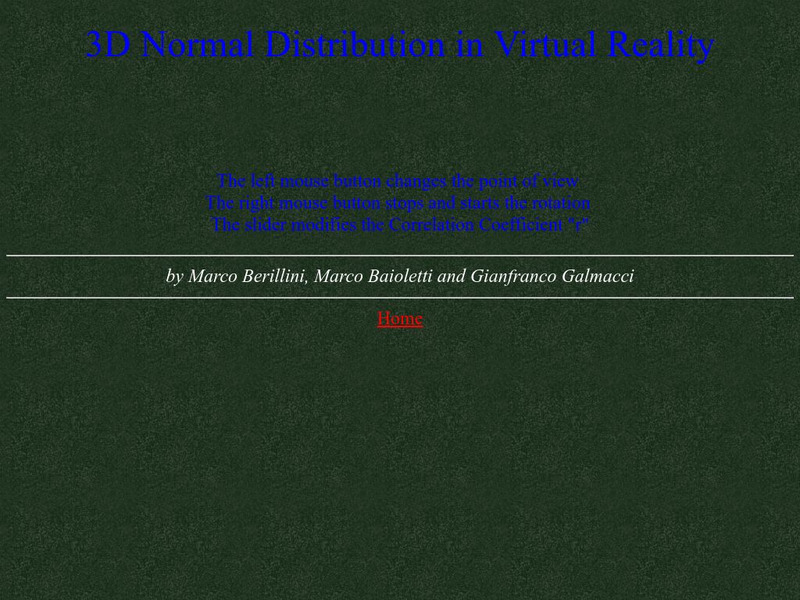
The Univ. of Peru provides a view of the normal distribution curve in 3-D! Provides a picture to help you visualize this concept.
Other
Fayetteville State University: Z Scores and Probability
Several paragraphs of explanation and graphs are found here to get across the concept of normal scores, z-scores, and the related probability in a simple fashion. This page is part of a collection from the university on basic statistical...
Interactive Mathematics
Interactive Mathematics: The Normal Distribution
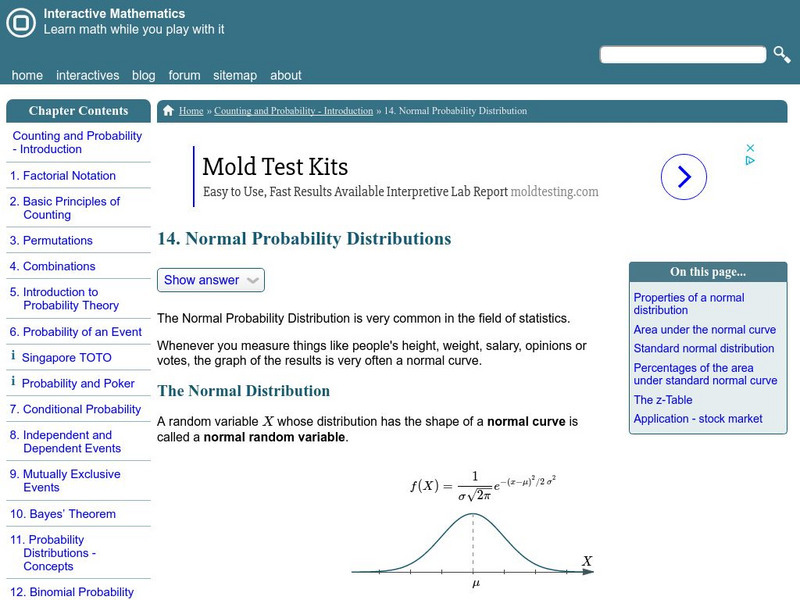
Formulas and properties of the normal distribution are presented, including details on the normal random variable and the standard normal distribution. Several real world examples are also included with detailed solutions.
Interactive Mathematics
Interactive Mathematics: Probability and Statistics
Mini lessons are provided for learning concepts in the world of probability and statistics. Topics include counting and probability, permutations, combinations, independent and dependent events, and distributions. Links to online...
Curated OER
Image for Function for Normal Curve
A short look at the formula and the graph of the statistical normal curve.
Curated OER
Image for What a Normal Curve Looks Like
A short look at the formula and the graph of the statistical normal curve.


