Bozeman Science
Bozeman Science: Position vs Time Graph Part 1
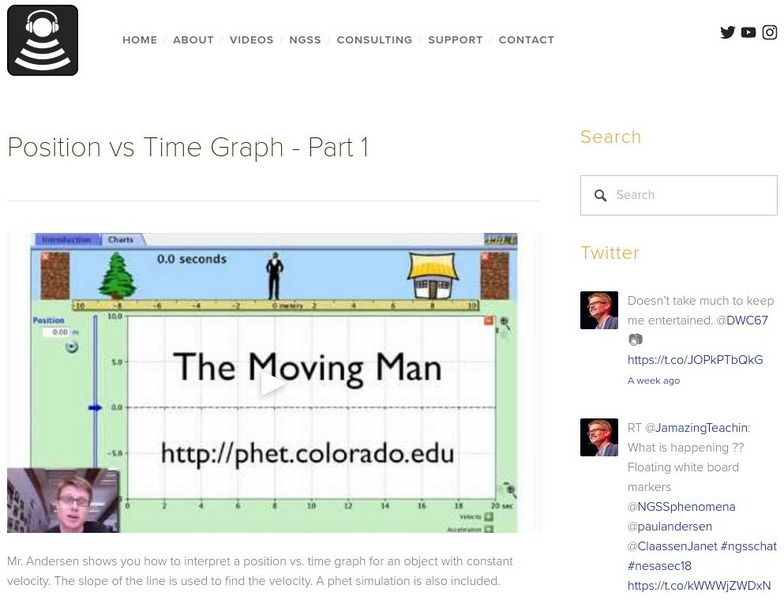
Mr. Andersen shows you how to interpret a position vs. time graph for an object with constant velocity. The slope of the line is used to find the velocity. A PhET simulation is also included. [12:19]
Bozeman Science
Bozeman Science: Position vs Time Graph Part 2
Mr. Andersen shows you how to read a position vs. time graph to determine the velocity of an object. Objects that are accelerating are covered in this video. He also introduces the tangent line (or the magic pen). [13:01]

