Hi, what do you want to do?
University of Illinois
University of Illinois: Line Graphs
Line graphs are shown and explained here. You can learn what kind of data is best represented using a line graph. There are also line graphs with questions and answers available to help you learn how to read them.
The Math League
The Math League: Using Data and Statistics
This site contains two short examples of line graphs, charts that show change over time. This is a quick introduction to the topic of statistical graphing.
US Department of Education
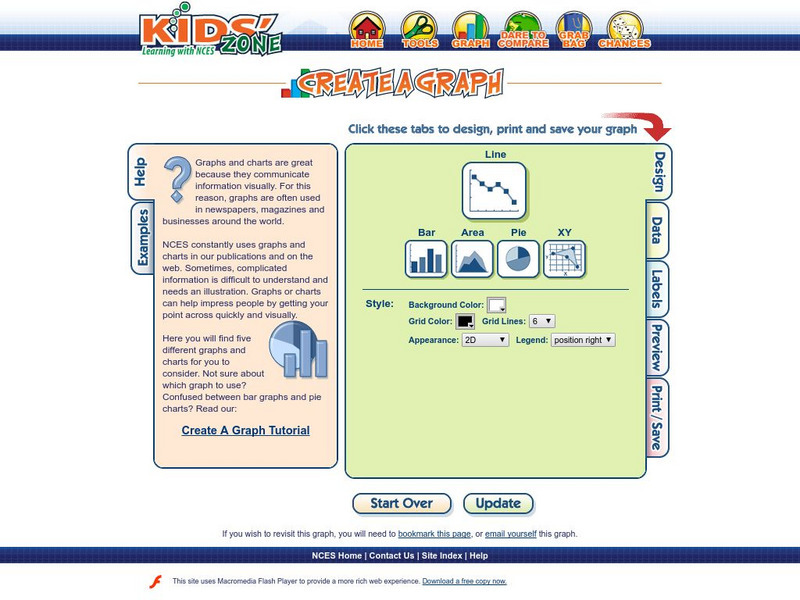
Nces: Create a Graph: Line Graph
This resource from the National Center for Education Statistics provides tools for creating line graphs right online! Select a type of graph, fill in the information, and voila! -- you have created a wonderful graph all your own!


