Hi, what do you want to do?
McGraw Hill
Glencoe Mathematics: Online Study Tool: Quiz on Frequency Distributions
Learners demonstrate comprehension of advanced mathematical concepts. The online quiz tests the students on frequency distributions.
CK-12 Foundation
Ck 12: Statistics: Frequency Polygons
[Free Registration/Login may be required to access all resource tools.] Construct frequency polygons.
Other
Scantips: A Few Scanning Tips
Wayne Fulton provides basic information on how to use a scanner for both photos and documents. Included are a question and answer section, a list of basic scanner software, ways to improve your scanning, and links to other scanner sites.
ClassFlow
Class Flow: Data Analysis Using Graphing
[Free Registration/Login Required] This flipchart allows students to analyze data using appropriate graphs, including pictographs, histograms, bar graphs, line graphs, circle graphs, and line plots introduced earlier, and using...
Shodor Education Foundation
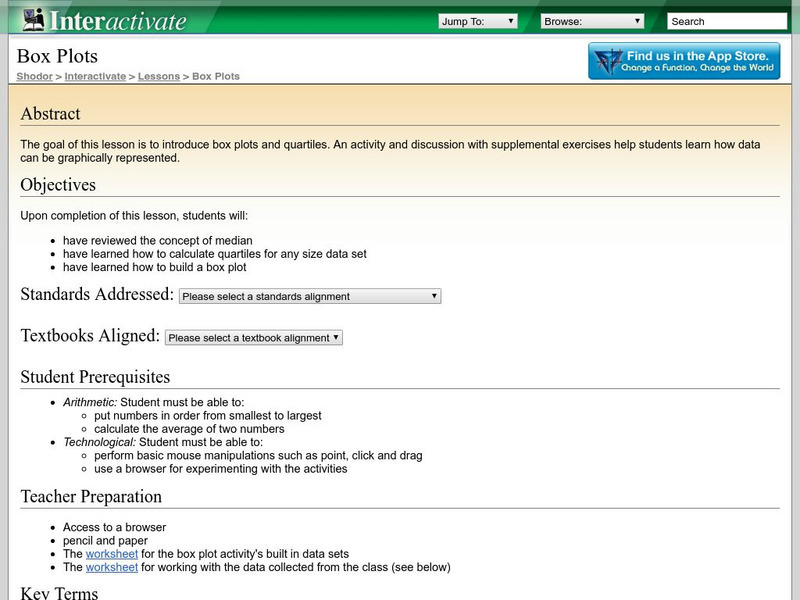
Shodor Interactivate: Lesson: Box Plots
This lesson plan introduces quartiles and box plots. It contains an activity and discussion. Supplemental activities about how students can represent data graphically are also included.
Oswego City School District
Regents Exam Prep Center: Categorizing Data
Three lessons on different types of data (qualitative, quantitative, univariate, bivariate, biased data) as well as a practice activity and teacher resource.
University of Georgia
University of Georgia: Inter Math: Histogram
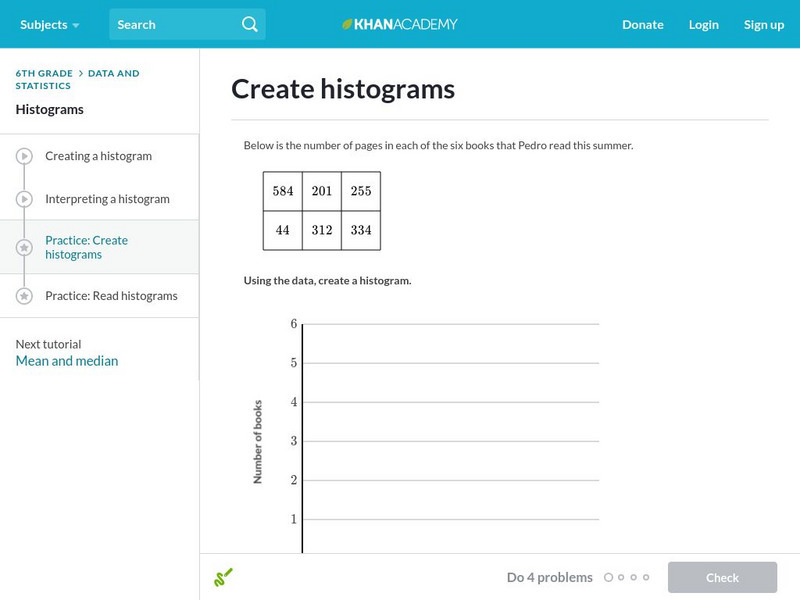
This site provides details about histograms. The site contains a link on the step by step procedure of creating a histogram. There are links to related terms, everyday examples, challenging problems, more information, and the interactive...
CK-12 Foundation
Ck 12: Types of Data Representation: Graphic Displays of Data
[Free Registration/Login may be required to access all resource tools.] Here you will explore displays of data using bar charts, histograms, pie charts and boxplots, and learn about the differences and similarities between them and how...
CK-12 Foundation
Ck 12: Statistics: Applications of Histograms
[Free Registration/Login may be required to access all resource tools.] Use calculators to create graphical representations of data, such as histograms.
CK-12 Foundation
Ck 12: Statistics: Histograms Grades 9 10
[Free Registration/Login may be required to access all resource tools.] Make a histogram given a frequency table.
CK-12 Foundation
Ck 12: Statistics: Stem and Leaf Plots and Histograms
[Free Registration/Login may be required to access all resource tools.] Make and interpret stem-and-leaf plots and histograms for a set of data.
McGraw Hill
Glencoe Mathematics: Online Study Tools: Histograms
This site gives a short interactive quiz which allows students to self-assess their understanding of the concept of histograms.
Alabama Learning Exchange
Alex: Who Bounces Best?
This is a cooperative learning, kinesthetic and presentation lesson. Learners will use the computer to create graphs/charts to display data collected by counting the number of successful bounces when bouncing a basketball for 30 seconds....
Alabama Learning Exchange
Alex: Misleading Graphs Are Da'pits!
In this interactive lesson, students will discover how creating an incorrect graph will display misleading information. Through viewing and discussing a variety of graphs, the students will identify 5 components that graphs must contain...
Alabama Learning Exchange
Alex: Representing Possibilities
The students will work through problems that will be represented in tables, equations, and graphs. This lesson was adapted from NCTM Student Math Notes, May/June 2007.This lesson plan was created as a result of the Girls Engaged in Math...
Alabama Learning Exchange
Alex: Box and Whisker With a Bed Sheet
The class will make a list of all of their classmates heights, ages in months, and shoe sizes. They will then use this data to create a human box-and-whisker plot. This lesson plan was created as a result of the Girls Engaged in Math and...
Better Lesson
Better Lesson: Hilarious Histograms. Analyzing and Creating
The students will be using real life data to create and analyze histograms. They will be surveying their classmates and using data from other grade levels to compare same topic information in a histogram.
Better Lesson
Better Lesson: Histogram Activity
Sixth graders will see how an actuary uses histograms to analyze the frequency of events to determine risk.
Shodor Education Foundation
Shodor Interactivate: Histogram
View histograms for built-in or user-specified data. Experiment with how the size of the class intervals influences the appearance of the histogram.
Shodor Education Foundation
Shodor Interactivate: Normal Distribution
Change the standard deviation of an automatically generated normal distribution to create a new histogram. Observe how well the histogram fits the curve, and how areas under the curve correspond to the number of trials.
Quia
Ixl Learning: Frequency Tables
Brush up on your math skills relating to frequency tables then try some practice problems to test your understanding.
Shodor Education Foundation
Shodor Interactivate: Misleading Graphs
This lesson will challenge students to think creatively by having them design and build water balloon catchers from random scrap materials, while requiring them to take into consideration a multitude of variables including cost,...
Louisiana Department of Education
Louisiana Doe: Louisiana Believes: Eureka Math Parent Guide: Statistics
A guide to support parents as they work with their students with statistics.


