Hi, what do you want to do?
Curated OER
It Has Been Rubbish For Years
Students are presented with the problems of percentages and focus upon numbers in contrast to 100. They calculate problems with money and are engaged with the use of games as a teaching tool. Students also interpret data as presented in...
Curated OER
When Ants Fly
Here is a great lesson on constructing line graphs. Learners identify common characteristics of birds, ants common needs of all living things. They also write a story from the perspective of an ant or a bird that has lost its home and...
Curated OER
Comparing School Bus Stats
Engage in a instructional activity that is about the use of statistics to examine the number of school buses used in particular states. They perform the research and record the data on the appropriate type of graph. Then they solve...
Curated OER
Use a Graph
Information is often presented in graph form. Can your youngsters read a basic bar or picture graph? Six word problems accompany three graphs. One graph is a bar graph and the other two are pictographs.
Curated OER
Double Bar Graphs - Practice 7.1
In this double bar graph worksheet, students make a double bar graph from given information, then solve related problems in addition to 2 test prep problems. Houghton Mifflin text referenced.
Texas Instruments
Texas Instruments: A Sweet Drink Adventure 7
Students determine how the temperature of water affects the dissolving time of a sugar cube. They create, interpret and analyze graphs of data, find an equation of the line of best fit, and relate slope to rate of change.
Texas Instruments
Texas Instruments: Animal Skin Adventure 6
In this adventure, students make two models to simulate the cooling rate of different skin surface areas and determine the effect of skin surface area on the results. Students graph temperature as a function of time, interpret, and...
Texas Instruments
Texas Instruments: Active Wear Adventure 10
In this adventure, students test which solar collector--black, white, or silver-- absorbs the most heat. They compare the difference between absorption and reflection. They create, interpret and analyze graphs of data. They also relate...
Texas Instruments
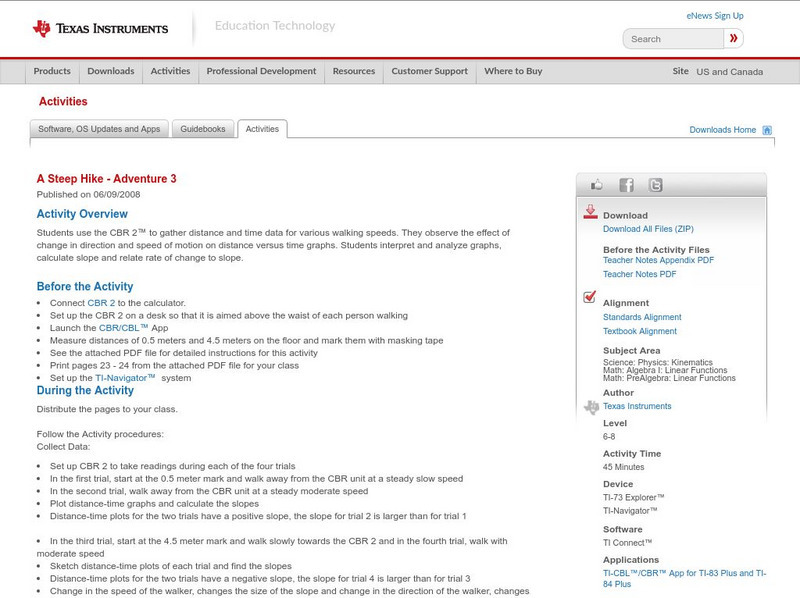
Texas Instruments: A Steep Hike Adventure 3
Students use the CBR 2 to gather distance and time data for various walking speeds. They observe the effect of change in direction and speed of motion on distance versus time graphs. Students interpret and analyze graphs, calculate slope...
Beacon Learning Center
Beacon Learning Center: Play Ball
An interactive web lesson shows examples of pictographs and challenges students to answer questions about the graphs.
PBS
Pbs Teachers: Tree Mendous Plots [Pdf]
To teach students how to use collect and use real-life data, use this lesson to create, populate and analyze graphs to interpret data related to the growth of plants from seeds. The lesson then asks students to create a story about the...
That Quiz
That Quiz
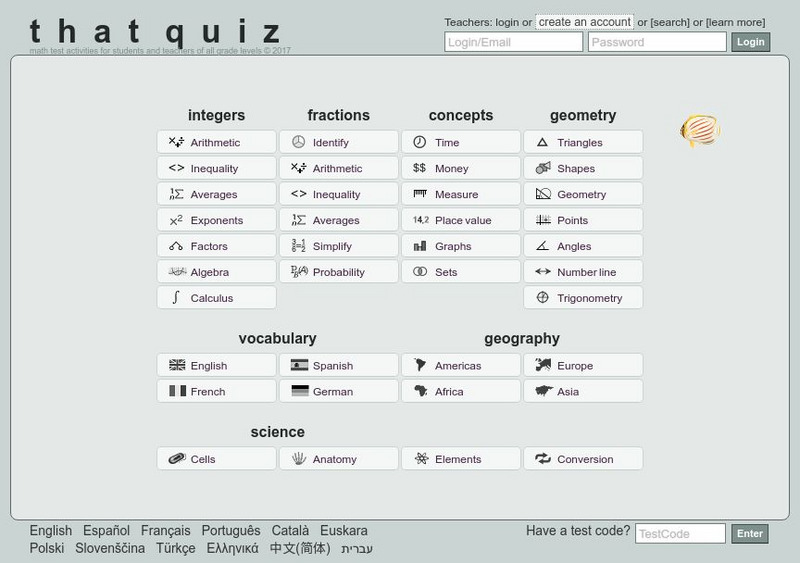
ThatQuiz is an excellent assessment tool for teachers and students. At this site, teachers can create individualized or group assessments on a variety of math topics. Students take these practice assessments directly online and receive...


![Pbs Teachers: Tree Mendous Plots [Pdf] Lesson Plan Pbs Teachers: Tree Mendous Plots [Pdf] Lesson Plan](https://content.lessonplanet.com/knovation/original/114247-36948766618258b08210c17f84fd1d88.jpg?1661419217)
