Hi, what do you want to do?
Curated OER
Histograms and Statistical Graphics
For this statistics worksheet, students solve 6 data problems. They construct a histogram of given data, they create a frequency polygon, and a stem and leaf diagram. Students create a dot plot and a pie chart for given data sets. On the...
Other
Online Statistics Education: Graphing Distributions [Pdf]
This is the second chapter of a statistics e-text developed collaboratively by Rice University, University of Houston Clear Lake, and Tufts University. It looks at many different types of data displays and the advantages and...
Palomar Community College District
Palomar College: Relative Frequency Polygon
A step-by-step worked problem from the Palomar College demonstrating how to take a set of data and produce a relative frequency polygon. Hints are provided along the way, and the final graph is shown for the user to check.
Palomar Community College District
Palomar College: Frequency Polygon an Example
A step-by-step worked problem demonstrating how to take a set of data and produce a frequency polygon. Hints are provided along the way and the final graph is shown for the user to check.
CK-12 Foundation
Ck 12: Statistics: Frequency Polygons
[Free Registration/Login may be required to access all resource tools.] Construct frequency polygons.
CK-12 Foundation
Ck 12: Types of Data Representation: Graphic Displays of Data
[Free Registration/Login may be required to access all resource tools.] Here you will explore displays of data using bar charts, histograms, pie charts and boxplots, and learn about the differences and similarities between them and how...
Wolfram Research
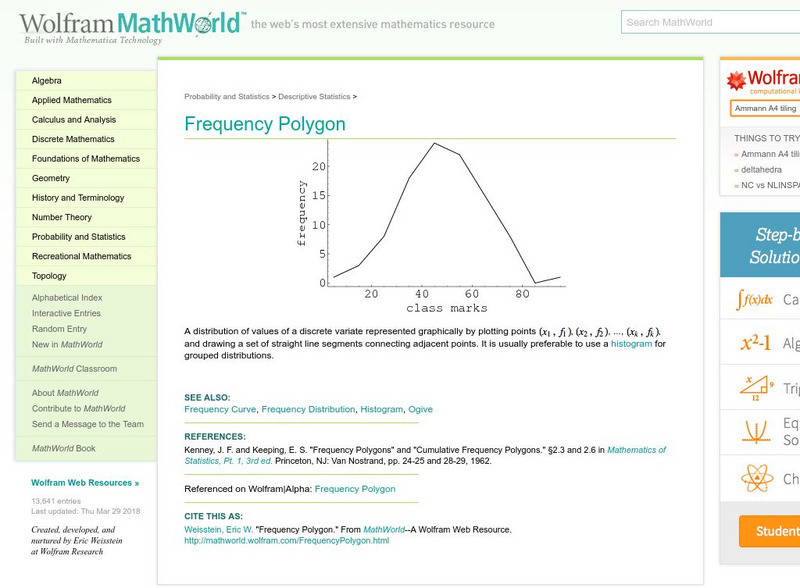
Wolfram Math World: Frequency Polygon
MathWorld provides a general overview of a frequency polygon, complete with a graphical example.
Richland Community College
Richland Community College: Stats Graphs Defined
Richland Community College provides a glossary of many terms that are needed in order to understand statistics graphs and charts. Each of the types of charts is quickly explained in terms of what it is most effective in displaying.


![Online Statistics Education: Graphing Distributions [Pdf] eBook Online Statistics Education: Graphing Distributions [Pdf] eBook](https://static.lp.lexp.cloud/images/attachment_defaults/resource/large/FPO-knovation.png)


