Hi, what do you want to do?
Khan Academy
Khan Academy: Video Games and Violence
In this video lesson students look at a set of data, transfer the data into a two-way table and then use that table to make inferences about the data.
Sophia Learning
Sophia: Frequency Distributions and Histograms
Explore how to use frequency distribution to organize data and determine the difference between histograms and bar graphs.
Imagine Learning Classroom
Learn Zillion: Calculate Probabilities by Using Data in a Two Way Frequency Table
In this video, you will learn how to calculate probabilities by using the data represented in a two-way frequency table. [6:48]
Math Mammoth
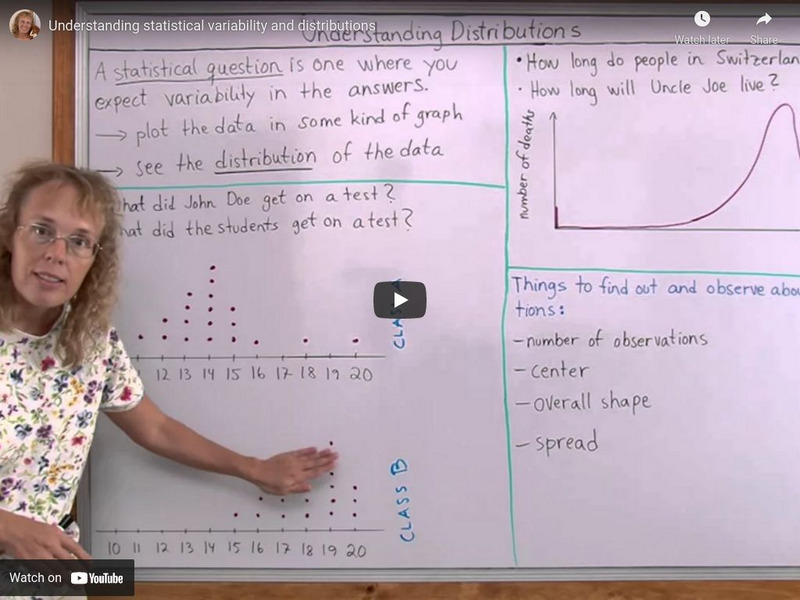
Math Mammoth: Understanding Statistical Variability and Distributions
This lesson explains what a statistical question is and how to describe the distribution of data by its center, spread, and shape. [7:08]
Khan Academy
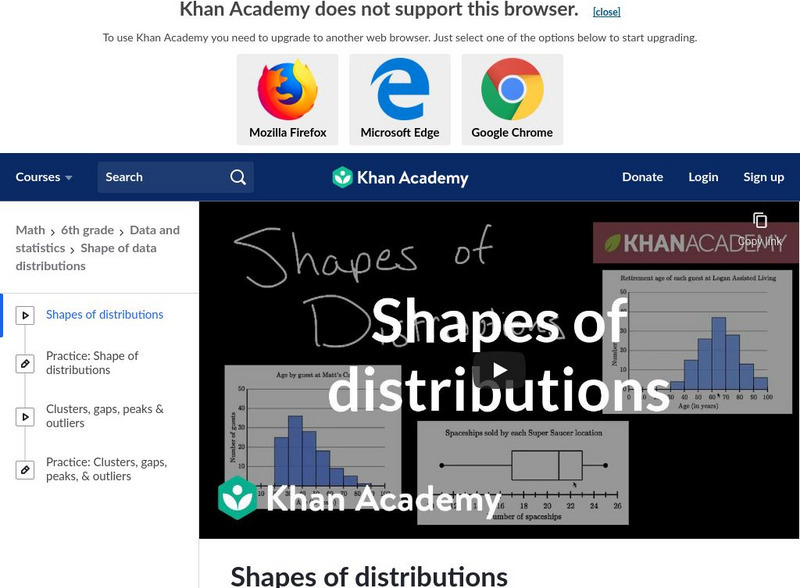
Khan Academy: Shapes of Distributions
This video discusses how to interpret a data display by looking at patterns and anomolies in the shape of its distribution. [5:06]
Khan Academy
Khan Academy: Marginal and Conditional Distributions
Marginal and conditional distributions from a two-way table (or joint distribution).
Sophia Learning
Sophia: Two Way Tables/contingency Tables: Lesson 3
This lesson will explain two-way tables. It is 3 of 3 in the series titled "Two-Way Tables/Contingency Tables." A transcript accompanies the video. [3:45]


