Hi, what do you want to do?
Other
Data: Empowering People
Find, download, and use datasets generated by the executive branch of the U.S. federal government to learn about our nation and the world.
Other
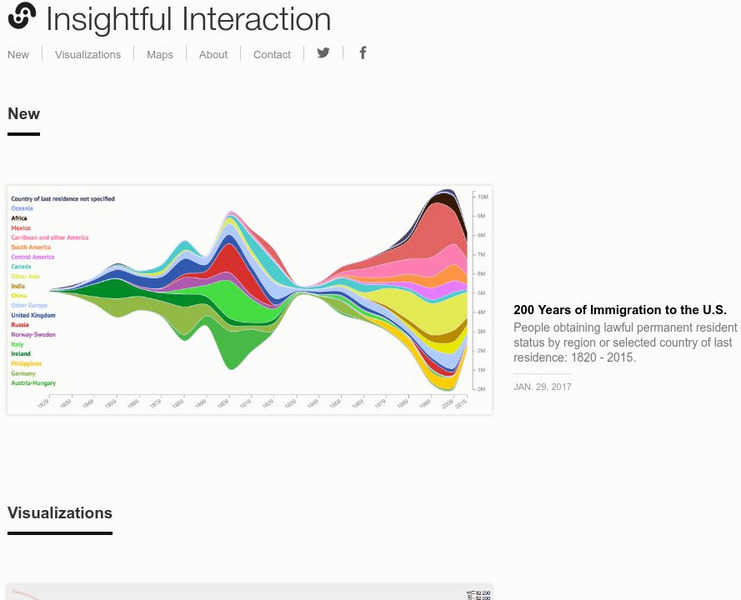
Insightful Interaction: Visualizations
A collection of interactive visualizations that were produced through analysis of economic, political, and market research data. Topics are diverse, e.g., military spending and trade, immigration, consumer spending, crime, unemployment,...
Other
Water on the Web
Water on the Web (WOW) is an advanced site allowing students to actively participate in data analysis from real research sites. Lesson plans on a range of topics are provided. There is also a tutorial for using Excel to graph WOW data.
Wolfram Research
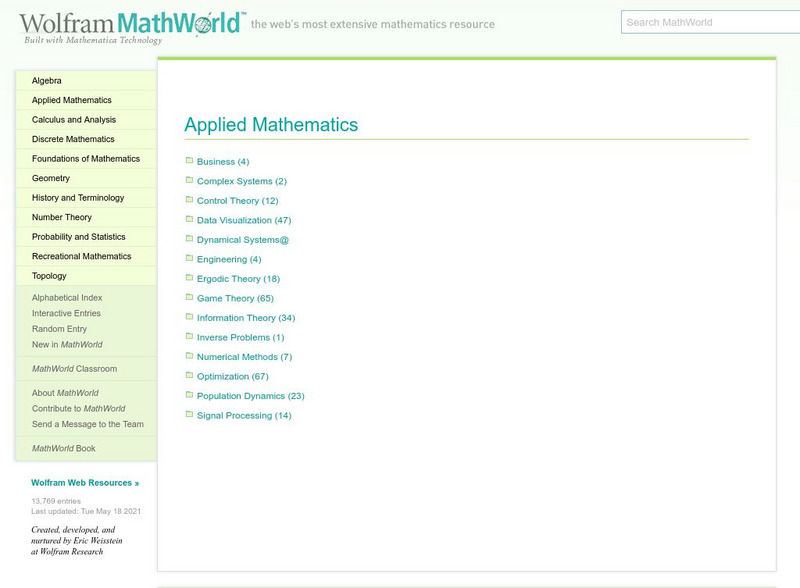
Wolfram Math World: Applied Mathematics Topics
Over a dozen topics in the field of Applied Mathematics are explored here. Each link contained detailed explanations of the area in question, along with examples and sketches that both teachers and students will find helpful.
TED Talks
Ted: Ted Ed: David Mc Candless: The Beauty of Data Visualization
Listen and watch as David McCandless turns complex data sets into beautiful, simple diagrams. He suggests that information design is really important because we all like to visualize our information. [18:19]
Wolfram Research
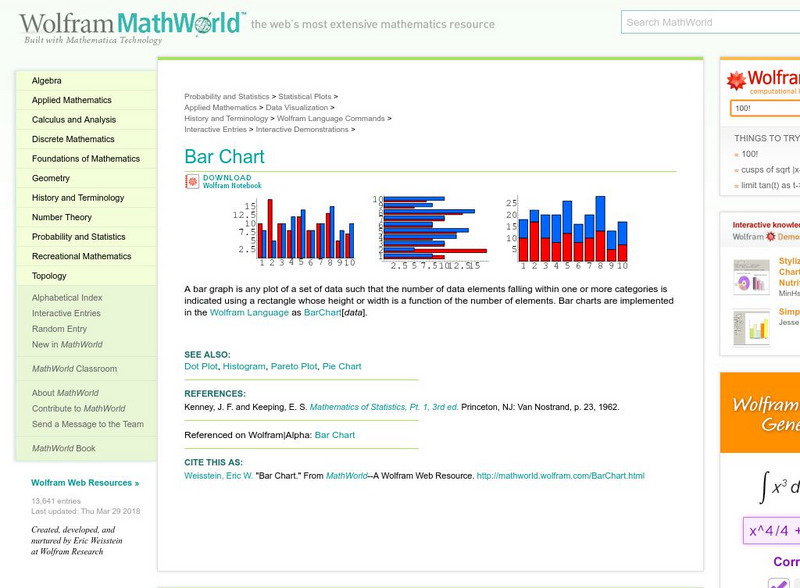
Wolfram Math World: Bar Chart
MathWorld offers a definition and example of the math term, "bar chart."
Other
Meta Chart: Create Box and Whisker Chart
Design and share box and whisker chart with this web-based tool.
Other
Meta Chart: Create a Single Bar Chart
Design and share single bar charts with this web-based tool.
Science and Mathematics Initiative for Learning Enhancement (SMILE)
Smile: Apples a Peel to Me
This lesson plan helps children understand how to graph data by using both real objects, apples, and pictures of apples. Great activity for a variety of themes.


