Wolfram Research
Wolfram Math World: Frequency Distribution
This site from MathWorld provides a general overview of frequency distribution, complete with a bar graph and explanatory text.
Texas Instruments
Texas Instruments: Math Today World Population in 2050
The data in the USA TODAY Snapshot "World Population in 2050" is in a relative frequency form. students can use the percents to calculate the population for each of the continents shown and then display this data as a bar graph.
Texas Instruments
Texas Instruments: Gambler's Fallacy: Longest Streaks
In this activity, students explore longest the streak for 7 tosses of a coin. They understand the relationship between relative frequency and Theoretical probability. They will be able to clear misconceptions about probabilities of streaks.
Texas Instruments
Texas Instruments: Two Way Tables
This set contains statistics questions regarding two-way tables, marginal frequencies, and Simpson's paradox. The student gives an in-context interpretation to a row or column relative frequency expressed as a percent.
Palomar Community College District
Palomar College: Relative Frequency Polygon
A step-by-step worked problem from the Palomar College demonstrating how to take a set of data and produce a relative frequency polygon. Hints are provided along the way, and the final graph is shown for the user to check.
McGraw Hill
Glencoe: Two Way Tables [Pdf]
This portion of an online textbook provides examples of two-way tables, vocabulary and practice problems.
Palomar Community College District
Behavioral Science Stats: Grouped Frequency Distribution
A sample problem that utilizes frequency distributions to find the frequency, relative frequency, intervals and cumulative relative frequencies for the given problem. The example is worked through step-by-step with a great explanation...
Science Education Resource Center at Carleton College
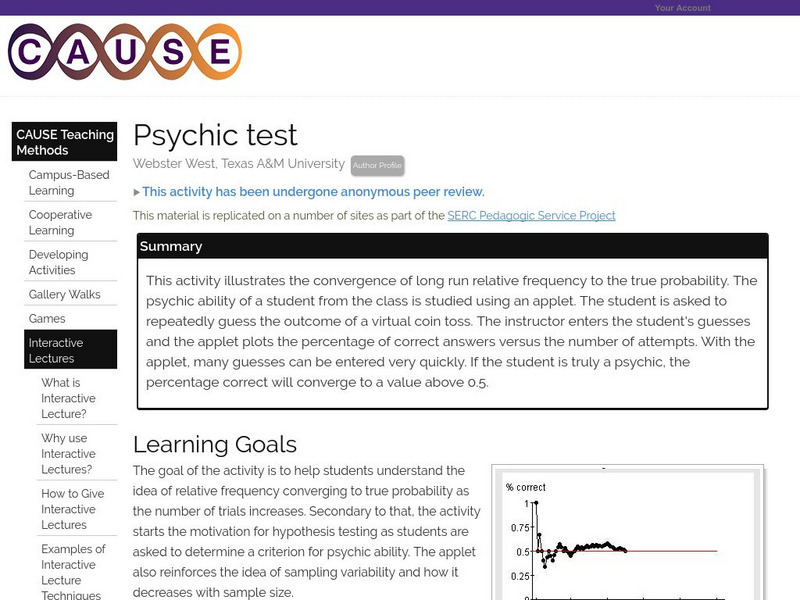
Serc: Psychic Test
This activity uses an applet to study the psychic ability of a student in the class who is asked repeatedly to guess the outcome of a virtual coin toss. Students will understand the idea of long-run relative frequency converging to true...
Khan Academy
Khan Academy: Interpreting Two Way Tables
Do you understand how two-way tables really work? Here's your chance to practice. Students receive immediate feedback and have the opportunity to try questions repeatedly, watch a video, or receive hints.
Texas Instruments
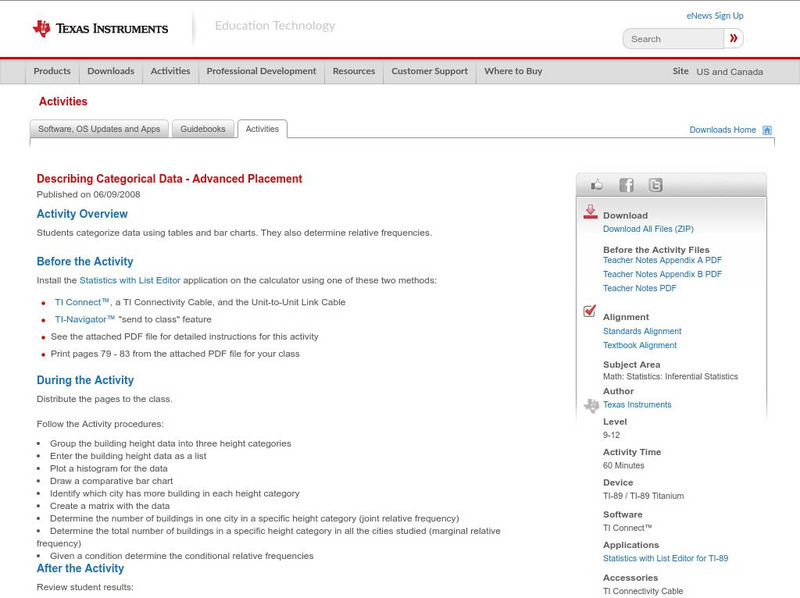
Texas Instruments: Describing Categorical Data Advanced Placement
Students categorize data using tables and bar charts. They also determine relative frequencies.
Other
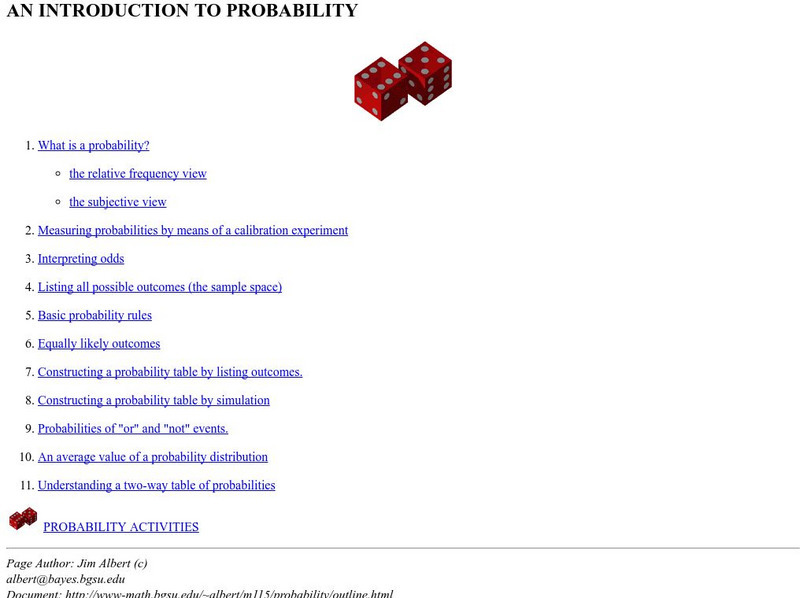
Bowling Green St Univ: Introduction to Probability
This site from Bowling Green State University provides an introduction to probability. It discusses topics and activities such as interpreting odds, listing all possible outcomes (the sample space), basic probability rules, equally...
Other
Stat Trek: Two Way Tables
This website provides students instruction on how to construct and interpret two-way tables.
Khan Academy
Khan Academy: Two Way Relative Frequency Tables and Associations
A set of three problems where students fill in a relative frequency table, read the information in it and look for a relationship between the variables. Answers are accompanied by explanations.
Khan Academy
Khan Academy: Reading Two Way Relative Frequency Tables
Practice interpreting two-way relative frequency tables Students receive immediate feedback and have the opportunity to try questions repeatedly, watch a video or receive hints.
Khan Academy
Khan Academy: Cumulative Relative Frequency Graph Problem
Cumulative relative frequency graph problem.
Illustrative Mathematics
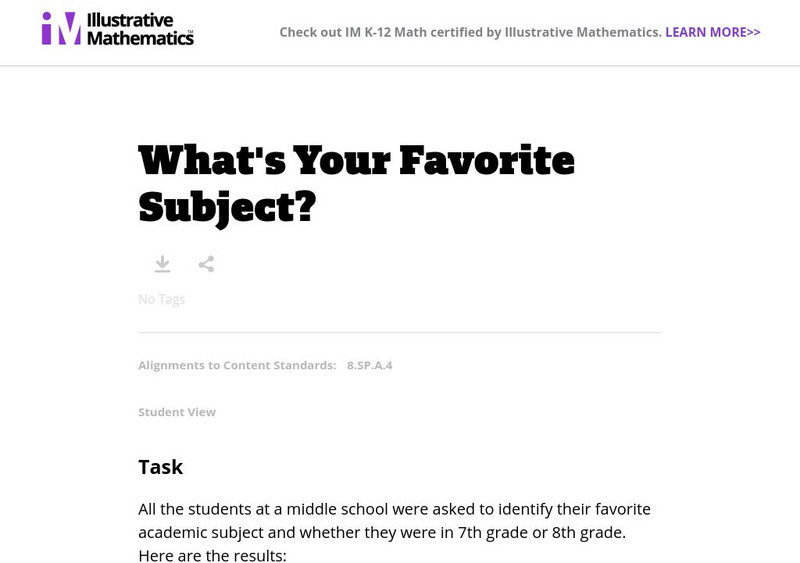
Illustrative Mathematics: What's Your Favorite Subject
This website provides a task in which students interpret data in a two way table by calculating the relative frequencies of a data set.
Richland Community College
Richland Community College: Stats Graphs Defined
Richland Community College provides a glossary of many terms that are needed in order to understand statistics graphs and charts. Each of the types of charts is quickly explained in terms of what it is most effective in displaying.
University of Illinois
University of Illinois: Spreading It Thick
Resource contains the definition for variance. It also shows students how to calculate the variance. There is a link to a bar graph that displays variance for the data example.




![Glencoe: Two Way Tables [Pdf] eBook Glencoe: Two Way Tables [Pdf] eBook](https://content.lessonplanet.com/knovation/original/108238-00003273f53572e51290174e1a53eb12.jpg?1661187814)
