Curated OER
Who Built It?
Seventh graders study the difference between architectural detail from the Romanesque and Gothic eras. The class participates in discussion on are in different eras. They predict what picture belongs in what era.
Curated OER
Technology - Data Collection
Students collect and analyze data from the United States Census Bureau. Using spreadsheet technology, students explore their results and make preductions about income groups. Students compute the mean, median and mode. They create...
Curated OER
Observing Fall Migrants
Students keep a detailed data collection log of the different types of monarch behavior. They track the weather conditions daily and link it to the migration of the monarchs. They summarize their data using either a graph or a computer...
Curated OER
Genetics Lesson
Students investigate the genetic nature of skeletons while collecting data from an Internet site. They read a case study on the Internet and complete the associated activity.
Curated OER
Language Arts: Five Senses Walk
First graders take a discovery walk around the school. They use their observations to compose a class book about their school.
Curated OER
Making Your Own Sampling Tools
Students begin a class recycling project. They create data sampling equipment using their own designs and test them in the field.
Curated OER
Computing Mean, Mode and Median
Ninth graders collect data on basketball player's heights and determine the mean, median, and mode for the data.
Curated OER
Geometric Figures
Young scholars compare, classify and calculate the area of geometric figures such as rectangles, squares, circles and triangles.
Curated OER
Collecting Data and Graphing
Eighth graders, in groups, count the different colors of M&M's in each kind of package and then draw a pictograph to show the results. Each group writes a program to show their results and then compare the manually-drawn and computer...
Curated OER
Chart the Weather for Cities Around the World
Students orally describe Northern and Southern hemispheres, identify 7 continents, and point out specific countries and cities. They locate and record weather information.
Curated OER
Ketchup to Collecting Data
First graders collect data for a survey of 3 brands of ketchup and create class charts. They taste test three different brands of ketchup, and use the data to create a presentation. Tasty instructional activity!
Curated OER
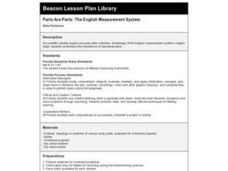
Parts Are Parts: The English Measurement System
Third graders view and measure common body parts to find a fathom, a span, and inch. They discuss the historical information about how standard English measurements came to be and why body parts can no longer be used as a standard...
Curated OER
Follow Spring's Journey North Recording Highlights of the Season
Students scan headlines on the Journey North News Updates each day to track the changes that spring brings as it comes to different areas of the United States.
Curated OER
Walking the Plank
Eighth graders experiment with a bathroom scale, books and a plank to determine how weight readings change as distance is applied. They graph and interpret the results.
Curated OER
Raisin Cane
Students estimate and record the number of raisins in a snack-size box. They also graph their results and note the differences (+ or -) from their estimate and actual number.
Curated OER
Viewing Tubes
Learners complete a lab in order to discover if the length of a viewing tube, its diameter, or the distance from an object affect the type of data collected and the resulting graph.
Curated OER
Bubbles
Third graders perform an experiment using different mixtures of dishwasher detergent. They construct bar graphs that record their bubble data for each detergent set.


