Curated OER
Details, Details
Young scholars explore statistics by participating in a personal details activity. In this data collection instructional activity, students identify the importance of personal information collection and how it can be used against them if...
Curated OER
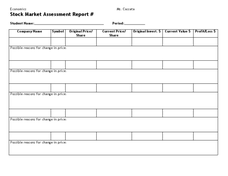
Stock Market Assessment Report
In this stock market assessment report activity, students track the progress of share prices in the stock market using the provided graphic organizer.
Curated OER
Plotting Data on a Graph
Students investigate graphing. In this graphing lesson, students survey the class and create graphs to reflect the data collected.
Curated OER
Interpreting Graphs
Students investigate graphs. In this graphing lesson plan, students create a graph regarding the population of California. Students extrapolate answers concerning the data set.
Curated OER
Seed Germination
Learners explore plants and the scientific method. In this plant growth instructional activity, students follow the steps in the scientific method to perform a seed germination experiment as a whole class. Learners work in a group to...
Curated OER
Let's Get Physical
Students collect data using the CBL. In this statistics lesson plan, students predict the type of graph that will be created based on the type of activity the person does. The graph represents heart rate depending the level of activity.
Curated OER
Results and Conclusions
Fourth graders practice using the scientific method. In this results and conclusions lesson, 4th graders review data collected, create a graph of their data and make their final conclusions about the information collected.
Curated OER
Mean, Median, & Mode
Students determine mean, median, and mode. In this problem solving lesson, students evaluate a set of data to determine the mean, median, and mode. Students work in small groups practicing cooperative learning skills as they problem solve.
Curated OER
Drip, Drip, Drip or The Case of the Leaky Faucet
Students explore the cost of wasted water. In this math lesson, students conduct an experiment in which they collect data on how much water is lost when a faucet leaks. Students figure the cost of the water that was wasted.
Curated OER
Center and Spread
Students collect and analyze data. In this statistics lesson, students define and calculate the range, median and standard deviation. They identify reasons for a skewed distribution.
Curated OER
Canada Data Map
Learners collect data and analyze it. In this algebra lesson, students collect data on the population characteristic in different regions. They use population, culture, settlement and others to help in their criteria.
Curated OER
Are There Too Many Elk?
Students use information about elk populations in Arizona to make recommendations about population management. In this ecology instructional activity, students discover the problems associated with having a heard of elk that is too...
Curated OER
Water Quality
Learners examine water quality and how to improve it, how to measure it and how it relates to human activities. In this water quality lesson plan students sample water from different sources, and test the samples.
Curated OER
Baroque Composers
Fourth graders study Baroque composers. In this music lesson, rotate trough three stations, collecting information on particular Baroque composers. Worksheets, information cards, and procedure included.
Curated OER
Tally the Objects in the Picture
In this tally the objects in the picture worksheet, 1st graders count the objects in each picture and place a tally mark in the chart as a means of collecting data.
Curated OER
Thinking Science - Collecting Data
In this data collection worksheet, students write the data that can be collected about bluebirds and nests and the tools they would use to collect this data. Students complete 14 rows of data.
Curated OER
Countdown to Disaster
Students discover the potential dangers of weather in their hometown. In this environmental lesson, students research Hurricane Hugo and the devastation it caused South Carolina in 1989. Students record weather data from their city and...
Curated OER
Clam Shell Data Collection Sheet
In this clam shell worksheet, students collect data about 10 clams and measure their length and width. They identify if the clam has a hole or not in its shell and they indicate the location profiled, date, time of day, tidal stage and...
Curated OER
Diagnosing Allergies Through Data Collection
Students research and organize information about allergies. In this data collection instructional activity, students watch a video about allergies. Students create a histogram using the information collected. Students complete the...
Curated OER
Vacation Matrix-Integrated Core
Students read aloud, "The Best Vacation Ever," by Stuart Murphy locate vacation spots on a map and describe their own vacations. Students illustrate their summer vacation spot and describe the vacation, placing it on a "vacation matrix"...
Curated OER
Documenting Science Through an Active Inquiry Process
Students follow procedures regarding scientific data collection. In this scientific inquiry lesson, students investigate inquiry questions through research and data collection. Students use technology tools to create products that...
Curated OER
Trundle Wheel
Sixth graders explore the uses of a trundle wheel. In this units of measurement lesson, 6th graders use trundle wheels to measure distances.
Curated OER
What's Your Favorite Season?
Students collect data on the favorite seasons. In this data collection and analysis lesson, students learn about displaying data on charts and graphs. They collect data about the favorite seasons of the children in their class and...
Curated OER
Making Good Money Choices
Students identify the needs of their community. For this communities lesson, students use a decision-making model worksheet to determine what community service project they should donate to. Students count the money they have to donate...


