West Contra Costa Unified School District
Multiplying Fractions
Three pages make up a reference document designed to assist families in providing the information needed for their children succeed in mathematics. Detailed descriptions and labeled examples showcase how to multiply fractions.
Chili Math
Multiplying Fractions
In fifth grade, young mathematicians extend their understanding of fractions to multiplying them together. Give them a worksheet that has them do exactly that. Class members solve five fraction multiplication problems, including one with...
START-Education
Equation Solving Review C
I'm a fan of clearing the denominator, but solvers can also find common denominators and cross multiply to solve the linear equations on the worksheet. Each of the six problems has rational coefficients.
Teacher Created Resources
How to Calculate Discounts and Sales
Teach discounts and sales with a straightforward learning exercise. After reviewing the concept, pupils solve word problems related to dollars and percentages. The second half of the sheet prompts learners to continue solving problems...
Consumers Energy
The Cost of Electricity
How much is your toaster costing you every day? Young environmentalists calculate the monetary costs of household appliances based on their average consumption of wattage.
Virginia Department of Education
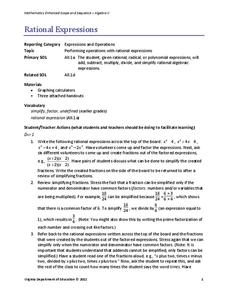
Rational Expressions
Demonstrate the progression of operations with rational expressions through a multi-day instructional activity, equipped with worksheets for each day. High schoolers develop the concepts needed to perform operations with rational...
Willow Tree
Circle Graphs
Pie isn't just for eating! Scholars learn to create pie charts and circle graphs to represent data. Given raw data, learners determine the percent of the whole for each category and then figure out the degree of the circle that percent...


