National Sailing Hall of Fame
Sail Area Calculations
Do bigger sails mean that the sailboat goes faster? Middle and high schoolers compare sailboats, and learn that simply calculating sail area is not enough. A slideshow presentation demonstrates how to calculate the Sail...
Council for Economic Education
Calculating Simple Interest
How much is owed? A calculated resource introduces the simple interest formula with a video that describes how to use it. Classmates then show what they know by answering questions within a simple interest worksheet.
EngageNY
Calculating Conditional Probabilities and Evaluating Independence Using Two-Way Tables (part 1)
Being a statistician means never having to say you're certain! Learners develop two-way frequency tables and calculate conditional and independent probabilities. They understand probability as a method of making a prediction.
EngageNY
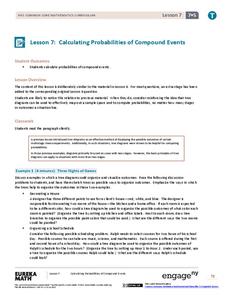
Calculating Probabilities of Compound Events
Use tree diagrams with multiple branches to calculate the probabilities of compound events. Pupils use tree diagrams to find the sample space for probability problems and use them to determine the probability of compound events in the...
EngageNY
Calculating Probabilities for Chance Experiments with Equally Likely Outcomes
Calculate theoretical probabilities and compare them to experimental probabilities. Pupils build on their knowledge of experimental probabilities to determine theoretical probabilities. Participants work several problems with the...
Pingry School
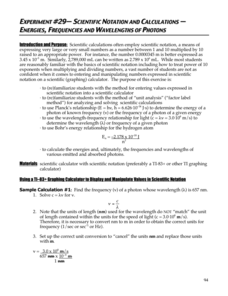
Scientific Notation and Calculations – Energies, Frequencies, and Wavelengths of Photons
The calculator has an interesting way of displaying numbers in scientific notation, but don't let that confuse your pupils! A lesson designed to give learners practice with scientific notation and calculators provides several practice...
Kentucky Adult Education
Probability Lesson Plan
Roll the dice with this multimedia math instructional activity on probability. After first viewing a series of three short videos explaining probability, independent events, and dependent events, young mathematicians...
Math Worksheets Land
Markups and Markdowns Word Problems - Guided Lesson
Show your shoppers that knowing how to calculate the percent increase or decrease of an item is a handy tool to know when they are looking for a good sale. Use as a quick three example introduction to the topic. The guided practice...
Mathalicious
Been Caught Stealing
You're safe, when calculating the odds of stealing second base! Learners compare the rate of a runner to the distance the ball travels, in a lesson that explores right triangles and measurement. Full of discussion questions and fun...
EngageNY
Calculating Probabilities of Events Using Two-Way Tables
Tables are useful for more than just eating. Learners use tables to organize data and calculate probabilities and conditional probabilities.
EngageNY
Using Tree Diagrams to Represent a Sample Space and to Calculate Probabilities
Cultivate the tree of knowledge using diagrams with two stages. Pupils create small tree diagrams to determine the sample space in compound probability problems. The lesson uses only two decision points to introduce tree diagrams.
Centre for Innovation in Mamatics Teaching
Area, Perimeter and Volume
Develop young mathematicians' knowledge of two- and three-dimensional shapes with this geometry workbook. From learning about the classifications of different shapes and figures to calculating their area, perimeter, and volume, this...
Curated OER
All About Money
Few topics engage young mathematicians as much as learning about money. Through a series of shared readings and hands-on activities, children explore the US currency system, learning how to count money and calculate change as they create...
Virginia Department of Education
Exploring 3-D Geometry
Take young mathematicians on an exploration of the world of 3-D geometry with this seven-lesson unit. After first defining the terms perimeter, area, and volume and how they apply to the real world, students continue on...
American Chemical Society
Density of Water
We know solids have a density we can measure, but what about liquids? Lesson explores this concept and allows scholars to explore the relationship between volume and density. Graphing and analysis questions round out the activity.
EngageNY
More on Modeling Relationships with a Line
How do you create a residual plot? Work as a class and in small groups through the activity in order to learn how to build a residual plot. The activity builds upon previous learning on calculating residuals and serves as a...
National Research Center for Career and Technical Education
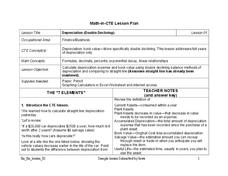
Depreciation (Double Declining)
Have you ever been told that your new car begins to lose its value as soon as you drive it off the lot? Aspiring accountants take on the concepts of depreciation and book value through an easy-to-deliver career and technology lesson. The...
EngageNY
Normal Distributions (part 1)
Don't allow your pupils to become outliers! As learners examine normal distributions by calculating z-scores, they compare outcomes by analyzing the z-scores for each.
EngageNY
Margin of Error When Estimating a Population Mean (part 2)
Don't leave your classes vulnerable in their calculations! Help them understand the importance of calculating a margin of error to represent the variability in their sample mean.
EngageNY
Determining Discrete Probability Distributions 2
Investigate how long-run outcomes approach the calculated probability distribution. The 10th installment of a 21-part module continues work on probability distributions from the previous lesson. They pool class data to see how conducting...
EngageNY
Estimating Probabilities by Collecting Data
Take a spin to determine experimental probability. Small groups spin a spinner and keep track of the sums of the spins and calculate the resulting probabilities. Pupils use simulated frequencies to practice finding other probabilities to...
EngageNY
Graphs of Linear Functions and Rate of Change
Discover an important property of linear functions. Learners use the slope formula to calculate the rates of change of linear functions. They find that linear functions have constant rates of change and use this property to determine if...
Baylor College
Calculating Exponential Growth
There can be a steep learning curve when teaching about exponential growth, but the lesson helps kids make sense out of the concept. When talking about exponential growth of viruses, learners may not be very interested, but when you are...
Howard Hughes Medical Institute
Calculating Iridium Fallout from an Asteroid Impact
Should we be afraid of a large asteroid impact on Earth today? Young scientists estimate the size and composition of an asteroid similar to the one that caused the K-T mass extinction. They apply algebraic formulas to answer questions...


