Curated OER
Introduction to Representing and Analyzing Data
Represent data graphically. Allow your class to explore different methods of representing data. They create foldables, sing songs, and play a dice game to reinforce the measures of central tendency.
PHET
Least-Squares Regression
Less is best when looking at residuals. Scholars use an interactive to informally fit a linear regression line to data on a scatter plot. The interactive provides a correct best fit line with residuals and correlation coefficient to...
Curated OER
Fantasy Baseball
Check out this thematic unit, based on the game of baseball. Learners investigate numbers and number relations as they become familiar with some of the basic terminology associated with the game. They focus their attention on actual...
Polar Trec
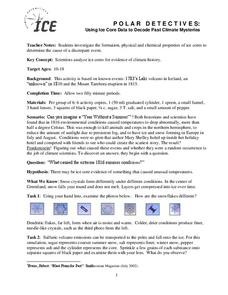
Polar Detectives: Using Ice Core Data to Decode Past Climate Mysteries
How does examining an ice core tell us about weather? Learners set up and explore fake ice cores made of sugar, salt, and ash to represent historical snowfall and volcanic eruptions. From their setups, scholars determine what caused the...
Teach Engineering
Recommendations and Presentations: Drum Roll Please
Teams analyze the data they collected during the past six lessons and finalize where they will build a survival cavern. They then present their decisions to the rest of the class and justify their locations.
Curated OER
Designing a Germination Experiment
Students explore botany by participating in a seed experiment. In this plant nutrition lesson, students define several science experiment vocabulary terms like observation, treatment, and replicate. Students utilize soaked seeds in a...
Curated OER
Measurement and Paper Airplanes
Sixth graders investigate physics by creating paper airplanes. In this flight experiment lesson, 6th graders utilize stationary tools to create elaborate paper airplanes which they fly on their school grounds. Students complete...
Beyond Benign
The Big Melt: Arctic Ice Caps
Are the Arctic ice caps really melting out of existence? Junior climatologists examine the statistics of ice decline through four math-based lessons. Each activity incorporates data, climate information, and environmental impact into an...
Pingry School
The Water Lab – Spreadsheet Simulation
More than 70 percent of people and 90 percent of businesses use spreadsheets regularly. While many courses overlook the important skill, the simple water lab focuses on entering spreadsheet data, formatting it, and printing plots based...
Curated OER
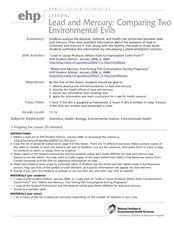
Lead and Mercury: Comparing Two Environmental Evils
High schoolers in chemistry or health courses look at the material safety data sheet (MSDS) and periodic table of elements to gather information about mercury and lead, two toxic materials that have been found in food products. They read...
Q Continuum
Planets
Have you ever looked up at the night sky and wondered what constellation you were seeing or whether that bright object was a star or a planet? Are you searching for the best tilt-to-view constellation and planet app that money can't buy?...
Curated OER
Learning to Interview
Second graders watch simulated interview between the teacher and a student before they interview a classmate using the form provided. Next, they complete two interviews of family members at home. They focus on the concepts of ancestors...
Curated OER
Voter Turnout
Explore politics by analyzing the voting process. Pupils discuss the purpose of casting votes in an election, then examine graphs based on the data from a previously held election's turnout. The lesson concludes as they answer study...
US Department of Commerce
Apportionment: Grades 3-4
Apportionment is a big word for young pupils. Use a helpful cartoon video and worksheet with data set to help them understand how the census fuels representative democracy. After examining how the census determines the number of seats a...
Curated OER
Coral Snapshots
Using photographs and a coral reef identification key, junior marine biologists compare changes in coral cover for a No-Take Area and the surrounding unprotected area. The data that is collected is then analyzed for richness,...
Curated OER
Origami Flight: The Physical Setting
Sixth graders investigate the forces that move certain objects. In this physics lesson, 6th graders design and create paper flying objects using origami methods, which they practice flying in different conditions. Students...
Centers for Disease Control and Prevention
Solve the Outbreak
Pretend to be an Epidemic Intelligence Service officer for the Centers for Disease Control and Prevention. Detectives deal with data and make decisions to determine the dawn of the disease!
EngageNY
Estimating Probability Distributions Empirically 2
Develop probability distributions from simulations. Young mathematicians use simulations to collect data. They use the data to draw graphs of probability distributions for the random variable in question.
Curated OER
Graph It with Coffee!
Students interview employers and employees at local coffee shops about sales and profits and create graphs comparing and contrasting information obtained about the businesses.
Curated OER
Contour Basics: JAVA Mac/PC
Students explore how to draw contour lines from limited data and extend this knowledge to real data sets. They participate in many opportunities from students to assess their own progress and the exercise is completely online.
Curated OER
Math:Survey Role-Playing Activity
Pupils create survey questions to discover why students join clubs. Using sampling methods and question phrasing techniques, they conduct the survey both in and out of school. Once pupils analyze their survey information, they suggest...
Curated OER
Galaxy Hunter - A Cosmic Photo Safari
Space science stars journey through our night sky and take virtual photos of galaxies to investigate simple random samples. Higher math is used to analyze the data collected. Copy the evaluation/assessment questions onto a handout...
Rochester Institue of Technology
Patient Flow
It's time to redesign the healthcare system. The seventh installment of a 9-part technology/engineering series teaches future engineers about patient flow and how to design healthcare centers to improve flow. Classroom simulations allow...
PBS
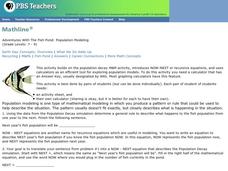
Adventures With The Fish Pond: Population Modeling
Build up from the previous activity where your learners charted the population growth and decay of a fish pond with M&Ms®. Have them look at the data from that activity and create a Now-Next, or recursive equations, to predict the...
Other popular searches
- Comparing Two Data Sets
- Comparing Sets of Data
- Comparing Related Data Sets
- Comparing Two Sets of Data


