Curated OER
Graphing Using Excel
Fifth graders complete a series of graphs by gathering information and using Excel to graph the information. For this graphing lesson, 5th graders graph favorite desserts of the class. Student put their results into the...
Curated OER
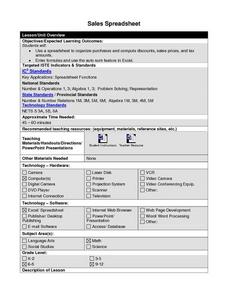
Sales Spreadsheet
Students use Excel spreadsheets to organize purchases, discounts, sales prices, and sales tax. Students follow step by step instructions and enter formulas as well as use the auto sum feature to calculate required calculations.
Curated OER
Access Ramp
Just about every public building that your students are familiar with has an access ramp which complies with ADA requirements. As it turns out, designing such a ramp is an excellent activity to incorporate slope, the Pythagorean Theorem,...
Houghton Mifflin Harcourt
Simple and Compound Interest
Your learners will get lots of practice calculating simple and compound interest by the end of this lesson. Simple explanations and examples lead learners through the concepts and steps of calculating simple and compound interest...
Curated OER
Statistical Pictures of School and Life
Students explore how mathematical data is used to summarize and illustrate everyday life. They apply mathematical concepts and skills to analyze data. Students conduct a five question survey of 50 people or more and graph the data.


