Curated OER
Statistics with State Names
Students analyze the number of times each letter in the alphabet is used in the names of the states. In this statistics lesson, students create a stem and leaf plot, box and whisker plot and a histogram to analyze their data.
Curated OER
Graphing Favorite Fruit
Third graders take poll and sort data, enter the data to create a spreadsheet and create bar and pie graphs.
Curated OER
The Five Senses
Study various objects and help kindergarteners use their five senses to classify the objects. They are presented with various objects and then use their five senses to sort and classify the objects. Then they use a Visual Ranking Tool to...
Curated OER
Speed + Graphing = Winners!
Fifth graders take addition timed tests every day for a two week period. Using the data from the timed tests, they create a bar graph using Microsoft Excel computer software, a personal bar graph using graph paper and colored pencils,...
Curated OER
Count The Letters
Students perform activities involving ratios, proportions and percents. Given a newspaper article, groups of students count the number of letters in a given area. They use calculators and data collected to construct a pie chart and bar...
Curated OER
Range, Mean, Median and Mode Through the Internet
Middle schoolers compute measures of central tendency. In this range, mean, median and mode lesson, students gather information on the internet, organize the data and then compute the measures of central tendency. They create a...
Curated OER
Cockroach Slope
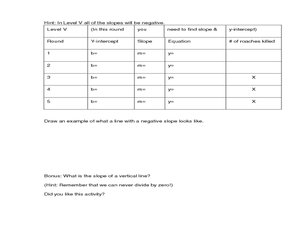
Students identify the slope of linear functions. In this slope lesson, students collect data and graph it. They write equations with no more than two variables and use technology to explain their data.
Curated OER
Graphing Made Easy
Fourth graders discover the appropriate way to construct and analyze bar, line, picto, and circle graphs. They set up frequency tables and perform some statistical analysis (mean, median, and mode) on their data.
Curated OER
Graphing Linear Equations Using Data Tables
Students review the Cartesian plane and the process of plotting points. In groups, students create tables, identify the slope and y-intercept, and graph the equation. Afterward, students perform the same process, only, individually. As a...
Curated OER
Keep It Cool
Young scholars complete a science experiment to study insulation, heat transfer, and permafrost. For this permafrost study lesson, students design and test a soda insulator. Young scholars graph their class data and discuss the results....
Curated OER
Geometric Relatioships
Students explore measurements and geometric formulas. In this geometry lesson, students investigate pi as it relates to geometry. They collect data and use a chart to organize the data.
Curated OER
One Hundred Hungry Ants
Primaries read the book One Hundred Hungry Ants and solve word problems based on the book. In this word problems lesson plan, students will be able to find the factors of a number by organizing counters into equal rows.
Curated OER
Firewood Problem
Middle schoolers write and solve their own story problems. They determine the cost of firewood by the cord. They organize their data in graphs and charts.
Curated OER
Using Computers to Produce Spreadsheets and Bar Graphs
Students review graphing terminology and how to plot data points, how to input data into a spreadsheet, and how to make a chart using a computer.
Curated OER
Charting a New Course
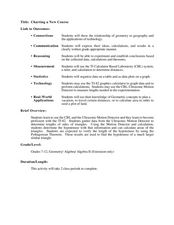
Young scholars calculate the distance they will travel. In this geometry lesson, students use the TI and CBL system to make calculation of a certain path. They explore geography by calculating distances between different areas as it...
Curated OER
Walk-A-Thon
Students graph linear http://www.lessonplanet.com/review?id=180542equations. In this problem solving lesson, students calculate slope and plot ordered pairs on a coordinate grid. Using a real-life example of a walk-a-thon, students...
Curated OER
Calendar Communication
Students identify days, dates, and month on a calendar. In this calendar instructional activity, students use a blank calendar page and fill in the days of the month. Students recall what they learned on specific days and record that...
Curated OER
Percents: What's the Use?
Students explore percentages in real world situations. In this percents lesson, students determine the final sales price after discounts. Students interview community members and determine how percentages are used in the real world.
Curated OER
Percents: What's the Use
Students research percentages in real world situations. In this percents lesson, students demonstrate their ability to apply percents to everyday situations. Students communicate mathematically by conducting interviews about percents and...
Curated OER
Virtual Field Trip
Students calculate gasoline cost per mile on a virtual field trip. They calculate the gasoline costs and travel time for each of the 2 routes, and record on a data sheet. They use Excel to create data tables for mileage, gasoline...
Curated OER
Paper Pool
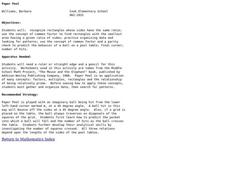
Students analyze the measurements of rectangles. In this analysis lesson, students will investigate patterns by looking at ratios. Students will also hypothesize the probability of a ball going into a certain pocket when playing pool....
Curated OER
Jelly Belly: What a Wonderful "Bean"!
Young scholars explore how jelly beans are produced. They discuss the origins of the jelly bean and view a video about how jelly beans are prepared, tested, shaped, finished, and shipped and estimate the amount of jelly beans in a jar...
Curated OER
Code Breakers
Students collect data and make a frequency table, change ratios into percents, and analyze data to make predictions.
Curated OER
Diagonal Lengths
Learners collect, organize, and analyze data while studying the Pythagorean Theorem, measure length and width of several rectangular objects, and compare the measured results to the calculated results.


