Curated OER
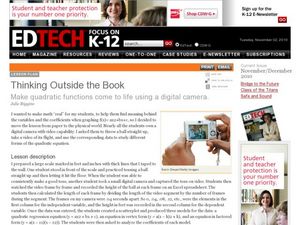
Thinking Outside the Box
Now this lesson sounds fun! Young scholars throw a ball, film it as it soars through the air, and use a spreadsheet to collect data. A scatterplot is created to produce a quadratic regression equation, an equation in vertex form, and an...
Curated OER
Matchstick Math: Using Manipulatives to Model Linear, Quadratic, and Exponential Functions
Playing with matches (unlit, of course) becomes an engaging learning experience in this fun instructional unit. Teach pupils how to apply properties of exponential functions to solve problems. They differentiate between quadratic and...
Curated OER
Quadratic Functions and Stopping Distance
Students solve quadratic equations. In this algebra lesson, students factor and graph quadratic functions. they use the properties of quadratics to calculate the distance.
Curated OER
Linear and Quadratic Model, Data Modeling
Students model quadratic and linear equations. In this algebra lesson, students solve word problems using equations. They create scatter plots and make predictions using correlations.
Texas Instruments
Let's Play Ball with Families of Graphs
Learners explore quadratic equations in this Algebra II lesson. They investigate families of quadratic functions by graphing the parent function and family members on the same graph. Additionally, they write the equation of the parabola...
Curated OER
The Kangaroo Conundrum: A Study of a Quadratic Function
Students play a game and collect data for their graph. In this algebra lesson, students solve quadratic equations and identify properties of their graph. They describe the pattern created by the graph and the game.
Curated OER
A Study of a Quadratic Function
Students factor and solve quadratic equations. In this algebra lesson, students play a game as the collect and graph data. they identify properties of their parabola and make predictions.
Curated OER
Don't Let Parabolas Throw You
Students identify relation, function, patterns and range. In this algebra lesson, students factor and graph quadratic equations. They use transformation to move the parabola around and make predictions.
Curated OER
Get Your Numbers in Shape - TI-83
High Schoolers use the TI-83 calculator to produce a sequence, explore patterns and find a linear or quadratic equation for a given pattern. They use inductive reasoning to make conjectures about patterns. They find the Y-value of a...
Kenan Fellows
Density
Most scholars associate density with floating, but how do scientists determine the exact density of an unknown liquid? The third lesson in a seven-part series challenges scholars to find the mass and volume of two unknown liquids. Each...
Curated OER
Strike a Pose: Modeling in the Real World (There's Nothing to It!)
Adjust this lesson to fit either beginning or more advanced learners. Build a scatter plot, determine appropriate model (linear, quadratic, exponential), and then extend to evaluate the model with residuals. This problem uses real-world...
Curated OER
Will Exams Be Cancelled?
If the flu outbreak continues, exams will have to be canceled. Investigate the properties of exponential and logarithmic functions. In this algebra instructional activity, young scholars use the TI to examine and differentiate between...
Curated OER
Means of Growth
Students collect and graph data. In this statistics lesson, students analyze their plotted data using a scatter plot. They identify lines as having positive, negative or no correlation.
Curated OER
From Playing with Electronics to Data Analysis
Students collect and Analyze data. In this statistics instructional activity, students identify the line of best fit of the graph. They classify lines as having positive, negative and no correlation.
Curated OER
Celsius to Fahrenheit
Students convert degrees between two different units. In this algebra lesson, students graph linear equations and identify the line of best fit. They use their line of best fit to make predictions given a set of data.
Curated OER
Hot Wheels
Students observe the action produced by toy cars. In this geometry instructional activity, students discuss motion and distance as they relate to the movement of a spherical object.They collect data and make conjectures based on their data.
Curated OER
Relating Distance and Velocity Over Time
Students calculate the distance and velocity over time. In this algebra lesson, students graph a linear function to represent the distance vers time travel. They interpret their graphs and draw conclusion.
Curated OER
The Swinging Pendulum
Students observe a pendulum and graph their observation. In this algebra lesson, students use the TI calcualtor to graph the motion the pendulum makes. They analyze the graph and make predictions.
Curated OER
Leap Into Exponential Functions
Studens identify the properties of exponents. In this algebra lesson, students grapha nd solve equaitons of exponential functions. They add, subtract, multiply and divide using exponents.
Curated OER
Leap Into Exponential Functions
Young scholars use properties of exponents to solve equations. In this algebra lesson, students add, subtract, multiply and divide exponential functions. They graph and differentiate between exponential growth and decay.


