Curated OER
Interpreting Graphs
Sixth graders interpret linear and nonlinear graphs. They create graphs based on a problem set. Next, they represent quantitive relationships on a graph and write a story related to graphing.
Polar Trec
How Much Data is Enough?
The next time you read a magazine or watch the news, make note of how many graphs you see because they are everywhere! Here, scholars collect, enter, and graph data using computers. The graphs are then analyzed to aid in discussion of...
Curated OER
A Picture is Worth a Thousand Words: Introduction to Graphing
Students practice graphing activities. In this graphing lesson, students discuss ways to collect data and complete survey activities. Students visit a table and graphs website and then a create a graph website to practice graphing.
Curated OER
Application of Graph Theory
Students investigate different online tutorials as they study graphing. In this graphing lesson, students apply the concept of graphs cross curricular and use it to make predictions. They define the purpose and theories behind graphs.
Shodor Education Foundation
Derivate
Derive tangent lines through derivatives. Scholars use an app to graph functions and investigate derivatives and tangent lines. The interactive automatically graphs a tangent line at a specified point and can also produce tables of values.
Curated OER
And the Survey Says...
Create a survey and graph! In this graphing lesson plan, students listen to a story about pets, create a survey for family and friends about what pets they own, and use the information to create a bar and line graph.
Curated OER
Problem Solving with the Wilderness Classroom
Students complete 45 multiple choice math word problems. In this math word problems lesson plan, students solve word problems on time, graphing, all four operations, money, and more.
Curated OER
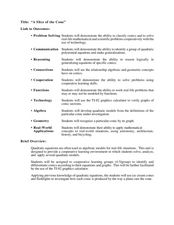
"A Slice of the Cone"
Here is a set of lessons that explore conics in a number of different ways. Starting with modeling how a conic is produced by the way a plane cuts the cone, to solving complex word problems, algebra learners progress through a series of...
Curated OER
Butterfly Addition: Color by Numbers
Children learning to add numbers up to 11 develop the strategy of using the larger number as the first addend and counting on from there to find a sum. They define addition and review the meaning of the plus (+) symbol. To practice, they...
Shodor Education Foundation
Regression
How good is the fit? Using an interactive, classmates create a scatter plot of bivariate data and fit their own lines of best fit. The applet allows pupils to display the regression line along with the correlation coefficient. As a final...
Curated OER
Circle Art
Learners investigate two and three dimensional shapes. In this geometry lesson, students write equations of circles and graph them correctly. They create pictures using circles.
Curated OER
Macbeth Madness
Pupils research Macbeth online and complete computer and graphing activities for the play. In this Macbeth activities lesson plan, students research Macbeth and bookmark the URL's. Pupils complete activities for the topic on spreadsheets...
Curated OER
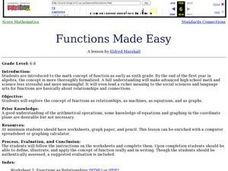
Functions Made Easy
Students explore concept of functions as relationships, as machines, as equations, and as graphs.
Curated OER
Chart the Stars
Seventh graders find constellation distances and plot the stars. In this star lesson, 7th graders plot the star points for Canis Major. Students use graphing calculators to graph the constellation. Students choose another constellation...
Curated OER
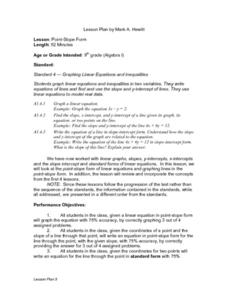
Point-Slope Form
Ninth graders explore the point-slope form of linear equations and graph lines in the point-slope form. After completing the point-slope equation, they identify the slope of a line through a particular point. Students explain the...
Curated OER
Stem-and-Leaf Plots
Seventh graders study steam-and-leaf plots. Given specific data, they create a stem-and-leaf plot . Students identify the mean, mode, range and median. Afterward, they review vocabulary words.
Curated OER
Youth vs. Adult Employment
Students investigate the unemployment rate in Canada. In this statistics lesson, students collect data on youth finding jobs, graph and analyze the data. This assignment raises awareness of the employment problems in Canada.
Spectrum
Grade 5 Standardized Test Prep
Here you'll find a great sampling of practice standardized test questions organized into four sections: ELA, mathematics, social studies, and science. Help your learners become familiar with the types of multiple-choice questions...
Curated OER
La Toteca- A Tropical Paradise
Students collect data on the time of the ferry. In this algebra lesson, students use the data to predict a ferry schedule. They also compute the depth where oxygen would be needed when diving.
Curated OER
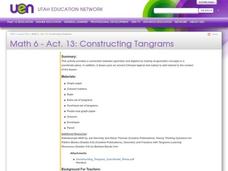
Constructing Tangrams
Seventh graders visualize and identify geometric shapes after applying transformations on a coordinate plane. In this tangrams lesson, 7th graders construct a set of tangrams and then answer extension questions related to measurement,...


