Curated OER
Transformations and Matrices
There are four activities in this extensive lesson covering the identity matrix and scaling, the linear representation of translations, the linear representation of rotations, and reflections. In small groups, they use the Cabri II...
Hawaiʻi State Department of Education
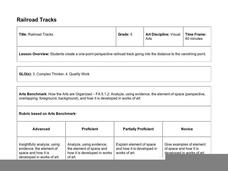
Railroad Tracks
Ahhh the vanishing point! Sounds ominous, but it's not. Fifth graders analyze the use of perspective in Renaissance art. They practice using linear perspective to draw railroad tracks that seem to go on forever. Tip: Make this...
Curated OER
Black Bayou Lake Measures Up
Pupils, in groups, estimate measurments and then select the tools needed and measure various items at Black Bayou Lake refuge.
Curated OER
Perimeter
Young scholars study about perimeter and the units used to measure perimeter using a variety of materials including their hands, feet, rulers, and computer applets. They understand such attributes as length, area, weight, volume, and...
Curated OER
Length, Perimeter, and Area
Pupils explore the concepts of length, perimeter, and area. In this math lesson, students use Shape Explorer to practice finding length, perimeter, and area.
Curated OER
Discovering Different Types of Functions
Graph polynomials and identify the end behavior of each polynomial function. The class differentiates between linear, quadratic, and other polynomial equations.
American Statistical Association
What Fits?
The bounce of a golf ball changes the result in golf, mini golf—and a great math activity. Scholars graph the height of golf ball bounces before finding a line of best fit. They analyze their own data and the results of others to better...
Curated OER
Math: a World of Symmetry
Pupils expand their knowledge of quadrilaterals and identify basic symmetrical forms. Over three weeks, they explore the math, application, and discussion of symmetry. After conducting Internet research, students create symmetrical...
Curated OER
Arc Length Lesson
Learners find the length of the arc of a circle. For this geometry lesson, students calculate the length of an arc and find the measure of the central angle given the length of the arc. They convert between linear and angular speed. They...
Curated OER
Who's got the fastest legs?
Students use a stopwatch to collect information for a scatterplot. In this fastest legs lessons, students collect data through the taking of measurements, create and find a median number. Students develop an equation and answer...
American Statistical Association
Step into Statastics
Class members study the size of classmates' feet and perform a statistical analysis of their data. They solve for central tendencies, quartiles, and spread for the entire group as well as subgroups. They then write a conclusion based on...
Curated OER
Robo-Pull
Students solve linear equations using two steps. In this algebra lesson, students add, subtract, multiply and divide to solve linear equations. They apply concepts of equations to a robot pulling cargo.
Curated OER
Where Is Japan? How Far Is That?
First graders use literature and hands-on activities with maps and globes to explain distance and tools used to measure distance. They select tools to measure various objects in the classroom, then apply those concepts to their map...
Shodor Education Foundation
Graphing and the Coordinate Plane
Ready to introduce your class to the coordinate plane? This website includes a detailed lesson plan that includes two interactive games to help learners practice graphing ordered pairs. The scripted discussion is a little cheesy and a...
American Statistical Association
Scatter It! (Predict Billy’s Height)
How do doctors predict a child's future height? Scholars use one case study to determine the height of a child two years into the future. They graph the given data, determine the line of best fit, and use that to estimate the height in...
Curated OER
Perimeter
Students explore the concept of perimeter. In this perimeter lesson, students discuss how to find perimeter of various shapes. Students use the Perimeter Explorer applet to find the perimeter of various shapes.
Curated OER
Scatter Plots and Line of Best Fit – TV Task
This handout begins by asking your statisticians to form hypotheses on the correlation between test scores and student height and test scores and the number of hours watching TV. Then using specific data, your class will create scatter...
Curated OER
Cartesian Coordinate System
Students research the Cartesian Coordinate System and its many uses in the world of mathematics and algebra.
Curated OER
What Are The Chances
Students calculate the probability of an event occurring. In this probability lesson, students differentiate between independent, dependent or compound events. They find the range of the data.
Curated OER
Means of Growth
Students collect and graph data. In this statistics lesson, students analyze their plotted data using a scatter plot. They identify lines as having positive, negative or no correlation.
Curated OER
Walking on Air
Students collect and analyze data with a graph. In this statistics lesson, students use central tendencies to find the meaning of their data. They display the data on a Ti calculator.
Curated OER
Optimization For Breakfast
Students identify he proportion of a cereal box. In this algebra lesson, students define the relationship between patterns, functions and relations. They model their understanding using the cereal box.
Curated OER
What are the Odds
Students predict the-outcome of an event. In this algebra lesson, students compare and contrast the probability of an event occurring. They calculate the odds of a simple event and make estimation.
Curated OER
Light Bounce
Students solve problems involving triangles. In this geometry lesson, students apply properties of triangles to find the missing angles and sides. They identify angles of parallel lines cut by a transversal.


