Curated OER
Slopes and Linear Equations
Students find the slopes of linear functions. In this graphing lesson, students analyze linear equations and calculate the slope of the line. They graph a line given the slope and y-intercept.
Texas Instruments
2B or not 2B a Functions
Learners use their graphing calculators to view graphs of equations. They tell if each equations is or is not a function and are shown pre-set graphs on their graphing calculators. They use the Quick Poll feature to indicate if the graph...
Curated OER
Move It
Studens collect and graph data. In this algebra lesson, young scholars use a CBL and CBR with a TI Calcualtor to observe linear graphs. They use the correct vocabualry as they discuss the collected data.
Curated OER
It's a Drag!
Students create number lines using decimals and whole numbers. In this algebra lesson, students graph and solve linear equations. They plot ordered pairs on a coordinate plane correctly.
Curated OER
Comparing Linear and Exponential Data
Young scholars graph linear and exponential equations. In this algebra lesson, students differentiate between linear and exponential equations. They relate it to the real world.
Curated OER
Local Linearity
In order to investigate local linearity, students graph the function on the TI-calculator and zoom to observe the change in slope on the line. They incorporate technology to visualize these problems.
Curated OER
Mathematics of Doodles
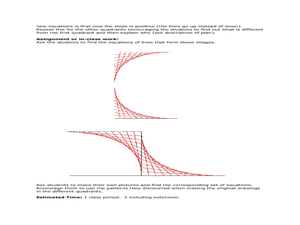
Students use the slope and y-intercept to graph lines. For this algebra lesson, students graph linear equations and apply it to solving real life problems.
Curated OER
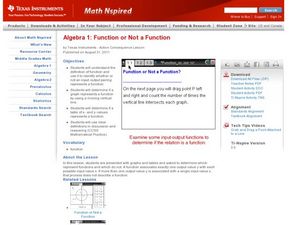
Function or Not a Function
Graphing linear equations on the TI is easy! Through examination of graphs and identification if it is a function or not, this instructional activity can relate to the real world.
Curated OER
The Function Elevator
Students solve and graph functions. In this precalculus lesson, students use piecewise function to relate real life scenarios. They analyze the graphs and identify the vertex and intercepts.
Curated OER
Linear Systems
Students solve and graph linear equations. For this algebra lesson, students solve systems of equations using elimination and substitution. They graph their answer and identify the point of intersection.
Curated OER
Impossible Graphs
Young scholars practice plotting functions on the Cartesian coordinate plane while participating in a discussion about the Possible Or Not worksheet/activity. Students also use the Impossible Graphs worksheet to practice reading a graph,...
Curated OER
Algebra 2 - Linear Programming
Students read real world problems, determine the variables, and set up the function using algebraic statements. After entering data into the graphing calculator, they display information in the form of graphs and scatter plots. ...
Curated OER
Graphing Linear Equations
Learners graph linear equations. In this algebra lesson, students solve linear equations and graph it on a coordinate plane. They evaluate integers using linear equations.
Curated OER
Composite Functions
Students create a poster to explain composite functions. For this composite function worksheet, students explore linear equations and functions. They complete a worksheet and use manipulatives to complete problems.
Curated OER
Graphing Linear Equations
Students graph linear equations. In this algebra lesson, students perform transformation on linear equations. They identify the slope and y-intercept of each line.
Curated OER
Constructing and Solving Linear Equations
Students solve linear equations In this algebra lesson, students create linear equations using integer coefficients greater than one. They graph their solution on a coordinate plane.
Curated OER
Quadratic Equations and Functions
This comprehensive lesson plan reviews solving and graphing quadratic functions and functions of higher degree. Using the vertex form of a quadratic functions, one finds the vertex, minimum or maximum, and axis of symmetry. A few word...
Curated OER
Equations from Unit Rates
Your class can become linear equations masters, as they calculate the rate of change of a function. They observe different types of coordinates as they relate to a graph, then use the Ti-navigator to move the line around and draw...
Curated OER
Off to College
High schoolers investigate linear, quadratic and exponential equations using the TI calculator. They identify relation and functions using ordered pairs, graph the data, analyze the data, and relate it to real-world situations.
Curated OER
Inequalities 7.3
Graph inequalities and discuss the difference in their slopes. Learners observe rate of change as they compare linear, quadratic, and cubic functions.
Ohio Literacy Resource Center
Solving Systems of Linear Equations Graphing
Do you need to graph lines to see the point? A thorough lesson plan provides comprehensive instruction focused on solving systems of equations by graphing. Resources include guided practice worksheet, skill practice worksheet, and an...
Curated OER
Finite Differences
Young mathematicians solve problems with polynomials. As they graph and analyze polynomial functions, learners define constant and finite, and determine the relationship between the constant set of differences and the slope of a linear...
Curated OER
The Phone Bill Problem
Students write an equation for a linear function. In this algebra lesson, students collect data, plot it and graph it. They identify the equation of the graphed data and define the slope and y-intercept of the graph.
Curated OER
Piecewise Modeling with Multiple Functions: Federal Debt
Students analyze data on debt and write an equation. In this statistics lesson plan, students are given data from different time periods, and are asked to graph and analyze the data. They work in groups, and are assigned different parts...
Other popular searches
- Graphing Linear Functions
- Linear Functions and Graphs
- Writing Linear Functions
- Nonlinear Functions
- Inverse Linear Functions
- Graphs of Linear Functions
- Nonlinear Equations
- Linear Functions Activity
- Linear Functions Math Models
- Linear Functions to Graph
- Linear Functions and Models
- Power Point Linear Functions


