Curated OER
Graphing Linear Equations - With Table
Students describe relations and graph linear functions. After studying a geometric shape and a verbal statement, students contrast the differences between the verbal statement and the picture. They determine functions and graph...
Curated OER
Interpreting Graphs
Sixth graders interpret linear and nonlinear graphs. They create graphs based on a problem set. Next, they represent quantitive relationships on a graph and write a story related to graphing.
Curated OER
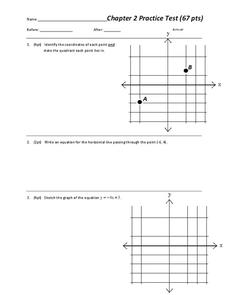
Chapter 2 Practice test
Overall, this worksheet contains a good selection of problems that reviews different aspects of linear equations. Learners examine and graph linear equations, absolute value equations, and inequalities in two variables. The three page...
Curated OER
Polynomials Functions
High schoolers factor polynomials and linear functions and apply concepts of the fundamental theorem of algebra to solve problems. They graph their solutions and analyze the graph.
Curated OER
Linear Functions-Learn Your Lines
Students solve and graph linear equations. In this algebra activity, students collect and plot data on a coordinate plane. They use the CBL and TI calculator to graph systems of equation.
Curated OER
Linear Inequalities in Two Variables
Graph and solve linear equations in two variables. The class relates the concepts of linear equations to the real world.
Radford University
Linear Equations in Real Word Problems
Make up a story about a linear graph. Scholars identify key features of a linear graph, such as intercepts, domain and range, and slope. They then create a word problem that could be represented by the graphed line.
Curated OER
Compound Inequalities and Graphing
Put geometry skills to the test! Learners solve compound inequalities and then graph the inequalities on a coordinate plane using their geometric skills. They identify the slope and y-intercept in order to graph correctly. I like this...
Curated OER
Linear Functions
Students solve and graph linear equations. In this algebra instructional activity, students collect data and plot it to create a linear function. They identify the domain and range of each line.
Curated OER
Products of Linear Functions
Students investigate the horizontal intercepts of functions. In this algebra lesson, students identify whether the factor of two functions results in a quadratic equation or not. They compare and contrast linear equations and higher...
Curated OER
Iterating Linear Functions
Learners use a spreadsheet to investigate data. In this algebra lesson, students collect and graph data on a coordinate plane. They explain properties of a linear equation both algebraically and orally.
Curated OER
Reading Graphs
Working independently or in teams, your class practices connecting graphs, formulas and words. This activity includes a guided discussion about distance vs. time graphs and looking at how velocity changes over time.
Curated OER
Using Tables to Solve Linear Functions
Oh that intercept! Budding algebra masters solve linear equations from standard to intercept form. They identify the slope and y-intercept to help graph the lines, an then create coordinate pairs using a table of values. Great TI tips...
Curated OER
Functions and Graphing
Graphing functions in a real world application makes math come to life. Learners graph points on a coordinate plane and identify various points on a graph by working through a set of real world problems. This is a perfect review exercise.
Curated OER
Graphing Integers
Fifth graders complete an integer graphing activity. In this integer graphing lesson, 5th graders use coordinate grids to help them complete linear functions and integer graphing.
Curated OER
Generating Points and Graphing
Students create a table of values to help them plot. In this algebra instructional activity, students plot their points on a coordinate plane creating a graph. They observe and analyze linear functions.
Curated OER
Piecewise Linear Integral
Young mathematicians solve and graph piecewise functions in this calculus lesson. They integrate linear functions containing restrictions and graph their answers using the TI.
Curated OER
Graphing Linear Equations
Students graph linear equations. In this algebra instructional activity, students solve linear equations and graph it on a coordinate plane. They evaluate integers using linear equations.
Curated OER
Activity 11: Family of Functions
Students investigate linear, quadratic, and absolute value functions. In this Algebra II lesson, students observe and describe family traits that exist among functions as they use technology to graph several functions on the same...
Curated OER
Graphing Inequalities in Two Variables
This study guide is a great resource to help you present the steps to graphing linear inequalities. Show your class two different ways to graph an inequality and work on a real-world example together. The document could also be easily...
Curated OER
Linear Functions
Students solve, identify and define linear equations. In this algebra lesson, students calculate the slope and y-intercept of a line. They graph the line given two points and the slope.
Curated OER
Modeling Linear Relationships
Students graph lines using the slope and y-intercept. In this algebra lesson, students create data using tables and equations. They use their data to make predictions and draw conclusion.
Curated OER
Impossible Graphs
Young scholars practice plotting functions on the Cartesian coordinate plane while participating in a discussion about the Possible Or Not worksheet/activity. Students also use the Impossible Graphs worksheet to practice reading a graph,...
Curated OER
Linear Graph
Students solve linear equations and graph the different functions. In this algebra lesson, students graph piecewise functions using the slope and y-intercept and the given restrictions on the domain of the line. They discuss rate of...


