Curated OER
Graphing Lines That Don't "Fit"
How can you graph lines that don't seem to fit on the given graph? What makes a line straight? What does the rate of change mean when graphing a line? How do you know if a slope is positive or negative? How do you know if the graph of a...
K-5 Math Teaching Resources
Blank Bar Graph Template
This template is just begging for your young mathematicians to fill it in with colorful bar graphs! With horizontal and vertical axes in place and grid lines for added support, this is a great resource for teaching children how to...
Curated OER
Systems of Linear Inequalities
Graphing systems of linear inequalities is the focus of this instructional activity. Problems range from checking solutions of inequalities, graphing systems of two inequalities, and graphing systems of three inequalities. Graphing...
Khan Academy
Challenge: Lined Paper
Now create your own graph paper with this JavaScript programming activity! First, change the while loop that draws horizontal lines into a for loop. Then, add another for loop that draws the vertical lines. For an added challenge,...
Curated OER
Graphs and Transformations of Functions
Is it possible to solve quadratic equations by factoring? It is, and your class will graph quadratic equation and functions too. They perform transformation on their graphs showing increasing and decreasing intervals, domain, and range....
Curated OER
Parallel and Perpendicular Lines
Young geometers get some solid skills practice in evaluating slopes. Beginning with the basics of slope through two points and progressing through properties of parallel and perpendicular lines, the building of skills is gradual and...
Curated OER
Interpreting Line Graphs
Fifth graders interpret line graphs. In this graphing lesson, 5th graders first begin by reviewing the difference in bar and line graphs and what they are used for. Students practice interpreting the data on various line graphs and using...
Curated OER
Practice Graphing y = mx + b
Ninth graders graph linear equations of the form y= mx + b. In this algebra lesson, 9th graders are able to graph a line given the slope and y-intercept. They can write the equations of a line given the graph of a line and can...
Curated OER
The Order of Things on a Coordinate Grid
High schoolers are able to identify ordered pairs on coordinate plane, and graph points on a coordinate plane. They are able to write an ordered pair for each of the points on a graph, and create a design or picture using ordered pairs.
Curated OER
Connecting With Coordinates
Play a coordinates game to encourage collaborative learning and grid use! Learners plot points on grids and play a game that challenges them to locate a specific point on a coordinate grid by using horizontal and vertical movements.
Curated OER
Show Me The Data!
Pupils create a bar graph. They will collect and organize data to turn into bar graphs. They create graphs for the favorite sports of the class, color of M&M's, and types of cars passing by.
Curated OER
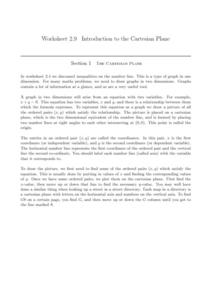
The Cartesian Plane
Learners solve and complete 22 various types of problems. First, they find the gradients of the lines and plot the given points. Then, they complete the table of values for each equation and use the table to draw the graph.
Utah Education Network (UEN)
Mathematics: Growing Patterns
Learners graph growing patterns using ordered pairs on a coordinate grid. They read The Fly on the Ceiling, a Math Myth.
Curated OER
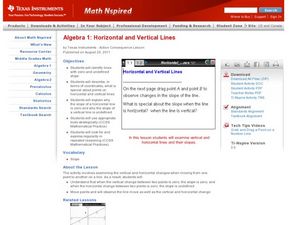
Horizontal and Vertical Lines
Students solve equations and graph-their solutions. In this algebra lesson, students, identify the type of line using the slope of the equation. They graph and observe their lines.
Curated OER
Points on a Line
How do you find slope? You use points on a line of course. slope. Teach your class how to calculate and differentiate between horizontal and vertical lines. They are sure to be pros at graphing lines on a coordinate plane by the end of...
Curated OER
Interpreting Graphs
Students investigate graphs. In this graphing lesson, students create a graph regarding the population of California. Students extrapolate answers concerning the data set.
West Contra Costa Unified School District
Conics Introduction and Parabolas
Where did conic sections get their name? The equation and graph of a parabola are developed from the definition of the conic section. Teacher examples on graphing the equation and writing an equation from the graph round out the plan.
Curated OER
Graphing Using Cookies
Students differentiate between bar graphs, line graphs, pictographs and bar graphs. After participating in a hands-on cookie activity, students label and draw their own graphs.
Curated OER
Equations of Horizontal and Vertical Lines
Students are given graphs of lines and asked to write an equation. In this algebra instructional activity, students are asked to write the equations for horizontal and vertical lines. They write equations for line crossing and going...
Curated OER
Graphing Linear Equations with Two Variables
Can your class solve linear equations in two variables? They will be able to after they engage in this lesson. Individuals graph linear equations in two variables using slope and intercept and identifying the relationship between the x...
Curated OER
Algebra 1: Slope as Rate
Students solve problems with slopes. In this algebra lesson, students identify the slope of a line and relate it to the rate of change. They graph their lines on the TI and observe changes in the lines.
Curated OER
Slope
Students graph lines and identify the slope. In this algebra lesson, students graph a line using y=mx+b and graph lines that are horizontal or vertical. They calculate the slope of the line using two points, and identify lines by their...
Curated OER
Coordinate Graphs, Translations and Reflections
Students perform translations and reflections. In this algebra lesson, students use the TI calculator to graph functions. They move the functions around on the coordinate plane using translation and reflection.
Curated OER
Slopes of Lines
Students examine a graph and relate it to the real world situation it depicts. They investigate changes in an equation and the appearance of a line. They investigate the connection between the graph of a situation and the meaning of the...


