EngageNY
Modeling a Context from a Graph
Collaborative pairs develop functions that model a graph from a context using the modeling cycle. They then analyze their function models in order to answer questions about the scenario.
Curated OER
Functions and Graphing
Graphing functions in a real world application makes math come to life. Learners graph points on a coordinate plane and identify various points on a graph by working through a set of real world problems. This is a perfect review exercise.
Ohio Literacy Resource Center
Solving Systems of Linear Equations Graphing
Do you need to graph lines to see the point? A thorough lesson plan provides comprehensive instruction focused on solving systems of equations by graphing. Resources include guided practice worksheet, skill practice worksheet,...
Curated OER
Matrix Analysis of Networks
Explore the connection between a finite graph, a directed graph, and a matrix. Graph lines and identify the relationship of matrices in real-world scenarios. Then use this information to work with a partner to plan and design a...
Curated OER
Graphing Linear Functions - Review
Young scholars graph linear functions. They plot three points, create a line, and discuss methods to find the slope of line. In groups, students solve problems, graph their lines and find the slope of a line using various methods. ...
Curated OER
Generating Points and Graphing
Students create a table of values to help them plot. In this algebra activity, students plot their points on a coordinate plane creating a graph. They observe and analyze linear functions.
Illustrative Mathematics
Graphs of Power Functions
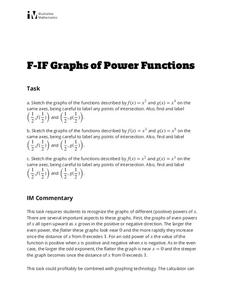
This activity consists of three exercises in which learners sketch the graphs of various power functions on the same axes. They use their sketches to make comparisons and observations which lead to generalizations about the graphs...
Curated OER
Cartoon Fractions
Students explore mathematics by viewing cartoons. In this math functions instructional activity, students read several "Peanut" cartoons on their worksheets as they solve fraction problems and compare them to the comic strip. Students...
Curated OER
Box Plots
Young statisticians are introduced to box plots and quartiles. They use an activity and discussion with supplemental exercises to help them explore how data can be graphically represented.
Curated OER
Practice: Word Problems
Congratulations, you've just hit the word problem jackpot! Covering an incredible range of topics from integers and fractions, to percents, geometry, and much more, this collection of worksheets will keep young mathematicians...
Curated OER
Cockroach Slope
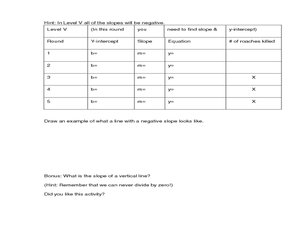
Students identify the slope of linear functions. For this slope lesson, students collect data and graph it. They write equations with no more than two variables and use technology to explain their data.
Curated OER
Parabolic Paths
High schoolers investigate properties of parabolas. For this algebra lesson, students identify the different paths of a parabola. They use the navigator to make observations of the parabola.
Illustrative Mathematics
Throwing Baseballs
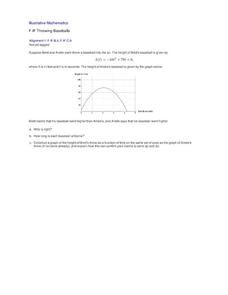
This is a wonderful exercise for learners to apply their critical thinking skills along with their knowledge of quadratic functions and parabolas. Young mathematicians investigate a real-world scenario about the height a baseball reaches...
Illustrative Mathematics
Influenza epidemic
This activity presents a real-world problem about an epidemic of influenza spreading through a city. Learners refer to a graph that shows the number of individuals infected in relation to the number of weeks that have elapsed since...
Mathematics Assessment Project
Representing Polynomials
Use this complete and very detailed lesson plan to assess your students' understanding of two important behaviors of polynomials. The first is the relationship between the zeros of a polynomial function and the function's graph, and the...
Illustrative Mathematics
Invertible or Not?
What determines whether a function has an inverse? Learners investigate that criteria when they examine values in a partially completed input-output table for two different functions. The task is to complete the table so that one of the...
Curated OER
As the Wheel Turns
This is not your typical Ferris wheel problem. In this exercise, your class will combine their knowledge of sinusoidal functions as well as linear motion to come up with parametric equations that model the position of a point on the edge...
Curated OER
Foxes and Rabbits 3
Use realistic data to find trigonometric models that best fit the populations of foxes and rabbits in a national park. Included are detailed explanations of the answers and process. This is a follow-up exercise to the lesson listed in...
EngageNY
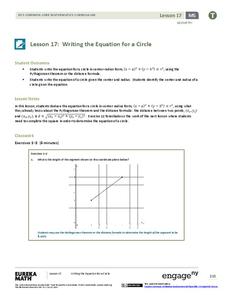
Writing the Equation for a Circle
Circles aren't functions, so how is it possible to write the equation for a circle? Pupils first develop the equation of a circle through application of the Pythagorean Theorem. The lesson plan then provides an exercise set for learners...
Curated OER
Big Wheels Keep on Turning
Eleventh graders work in groups and investigate how force determines the speed and distance then they view the video, "Math Vantage #7: What's Your Angle?." They are given a real life problem to solve using speed, ramps, angle, incline...
Curated OER
Between The Extremes
Students analyze graphs for specific properties. In this algebra lesson, students solve equations and graph using the TI calculator. They find the different changes that occur in each graph,including maximum and minimum.
Curated OER
Creating a Spreadsheet
Students create a spreadsheet using ICT. In this algebra lesson, students collect and graph their data using a spreadsheet. They find solution to a given problem using trial and error.
Curated OER
Skate Party
Learners use the Frayer model during problem solving. In this problem solving lesson, they examine multiple methods of data collection to solve real world problems. Resources are provided.
Illustrative Mathematics
Springboard Dive
Dive into this problem that illustrates a real-world application of the quadratic formula. Learners are given an equation that represents the height of a diver above the water t seconds after leaving the springboard. The task is to...


