Curated OER
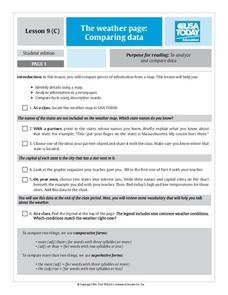
The Weather Page: Comparing Data
Students analyze data from maps. In this comparing data lesson, students use comparative and superlative statements to draw comparisons among the weather in different American cities based on USA Today weather maps.
Curated OER
Tantalizing Tangrams
Students construct a set of tangrams. In this geometry lesson, students read the book, Grandfather Tang's Story and retell the story using tangrams. Students construct their own set of tangrams using the included worksheets.
Curated OER
The Search for Pythagoras' Treasure
Students identify and define properties of triangles. In this geometry lesson plan, students identify the missing sides and angles of right triangles. They use the rules of the Pythagorean Theorem to solve their problems.
Curated OER
Introduction to Graphical Representation of Data Sets in Connection to Cellular Growth
Students practice graphing relationships between variables by studying topics such as exponential growth and decay. They conduct a series of numerical experiments using a computer model and a variety of physical experiments using mold,...
Curated OER
Graphs: All About Our Class
Students respond to survey questions, discuss results, brainstorm ways to represent survey information, and create table of class results. They find mean, range, and percentages, and create graph to display results.
Curated OER
Penguin Paradise
Students read about penguins and communicate their information in a one paragraph summary. In this penguin writing instructional activity, students review sentence construction. Students complete a KWL about penguins and read the book...
Curated OER
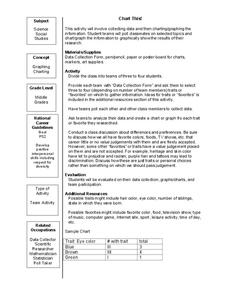
Chart This!
Students collect data and graph or chart the information. In this data organization lesson, students poll their classmates about certain topics and chart or graph the information to show the results of their research.
Curated OER
Chances Are-Part 1
Students are introduced to the idea of probability by discussing the likelihood of events occurring. Pupils describe events that are certain, impossible, likely, and unlikely to occur. They determine the likelihood of an event occurring...
Curated OER
Vocabulary Charts
Students create their own vocabulary charts. They divide into groups and view an example of a vocabulary chart imbedded in this plan. Then, they create their own chart which is based on a particular subject area.
Curated OER
Heads-Up Probability
Second graders use tree diagrams to predict the possible outcomes of coin tosses. The data they collect and graph also help them predict the likelihood of getting heads or tails when tossing coins the next time.
Curated OER
Chart Trivia
Students practice addition and subtraction problems and answer questions using greater than and less than. They chart information to create a graph on the computer.


