Shodor Education Foundation
Regression
How good is the fit? Using an interactive, classmates create a scatter plot of bivariate data and fit their own lines of best fit. The applet allows pupils to display the regression line along with the correlation coefficient. As a final...
Curated OER
Unit 13: Graphs, Correlation, Line of Best Fit
Students explore the concepts of graphs, correlations, line of best fit, and the dipstick problem. For this graph, correlation, line of best fit and dipstick problem lesson, students solve problems on the above mentioned topics. ...
Curated OER
Scatter-Brained
Seventh graders graph ordered pairs on a coordinate plane. They create a scatterplot. Additionally, they determine the line of best fit and investigate the slope of the line. Multiple resources are provided. An excellent resource!
Curated OER
Barbie Bungee
Middle and high schoolers collect and analyze their data. For this statistics lesson, pupils analyze graphs for linear regression as they discuss the relationship of the function to the number of rubber bands and the distance of the...
Yummy Math
Should NFL Quarterbacks Shave or Grow a Beard?
What does facial hair have to do with quarterback ratings? Using a set of data that provides QBR with and without facial hair, football enthusiasts determine if performance is affected. It also has learners question if the relationship...
Curated OER
Means of Growth
Students collect and graph data. In this statistics lesson, students analyze their plotted data using a scatter plot. They identify lines as having positive, negative or no correlation.
Curated OER
Wants and Needs
Here is an outstanding lesson on wants versus needs designed for 1st graders. Pupils listen to the book, Something Good which presents themes on wants, needs, choice, resources, and counting money. Pupils complete worksheets embedded in...
Curated OER
Scatter Plots
Seventh graders investigate how to make and set up a scatter plot. In this statistics lesson plan, 7th graders collect data and plot it. They analyze their data and discuss their results.
Curated OER
Linear and Quadratic Model, Data Modeling
Students model quadratic and linear equations. In this algebra lesson, students solve word problems using equations. They create scatter plots and make predictions using correlations.
Inside Mathematics
Coffee
There are many ways to correlate coffee to life, but in this case a worksheet looks at the price of two different sizes of coffee. It requires interpreting a graph with two unknown variables, in this case the price, and solving for...
Curated OER
Line of Best Fit
Students identify the line of best fit. In this statistics activity, students collect and analyze data. They calculate the regression equations and identify the different types of correlation.
Curated OER
Lines of Best Fit
High schoolers determine if there is an associationm in a scatter plot of data. They analyze data through predictios, comparisons, and applications. Students calculate the line of best fit using a graphing calculator. They display data...
Curated OER
Spelling Activity: Suffixes
Understanding spelling patterns is a vital tool. Suffixes ful, ness, ment, and ly are examined in this spelling patterns activity. The class determines how to use each suffix to change the meaning of a set of given root words.
Curated OER
Cruising the Internet
Students identify the parts of an engine using a graph. In this statistics lesson, students make a graph from their collected data. They calculate the volume of a cylinder using a line of regression and a scatter plot.
Math Moves U
Collecting and Working with Data
Add to your collection of math resources with this extensive series of data analysis worksheets. Whether your teaching how to use frequency tables and tally charts to collect and organize data, or introducing young...
Curated OER
Getting to the Point
Students determine location by using the technique of triangulation. They imagine that they are out in the wilderness and have come to the top of a ridge. How can one identify the ridge on the topo map? How can one figure out where you...
Curated OER
Why Would I Owe My Soul to the Company Store?
Sixth graders listen to "Sixteen Tons" by Tennessee Ernie Ford and discuss what it means to owe one's soul to a store. In this mathematics instructional activity, 6th graders determine what a miner's income was minus his expenses...
Curated OER
TE Lesson: I've Got Issues!
Learners study environmental issues from different perspectives. They look at the issues from the view of both preservationists and conservationists as they identify themselves with one group or the other. They determine how teamwork...
Curated OER
Line Best Fit
Students identify the line of best fit. In this statistics lesson, students analyze graphs and plots to identify positive, negative or no correlation. They find the line of best fit for different scatter plots.
Teach Engineering
Both Fields at Once?
An MRI uses both a magnetic and electricity, so how do the two interact with each other? Class members observe the effects on a charged particle when it is subject to both an electrical and magnetic field. The teacher background...
Curated OER
Math Instructional Technology Information
Students investigate the correlation between education and salary. In this business instructional activity, students analyze the salary rate for different jobs to determine if there is a correlation between the two. They graph their...
Curated OER
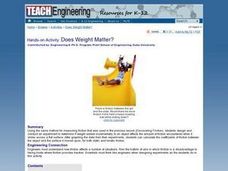
TE Activity: Does Weight Matter?
Young scholars design and conduct experiment to determine if weight added incrementally to an object affects amount of friction encountered when it slides across a flat surface. They graph data from their experiments, and calculate...
Curated OER
Energy Is Everywhere
Students determine the difference between renewable and non-renewable resources and identify the different forms of energy. They discuss life without energy and where energy comes from before reading an article about the different...
Curated OER
Currency and Exchange Rates
Fifth graders share the book, "The Story of Money" and discuss the uses of money, bartering, trade and the history of money. Students discuss various ways of spending: cash, check, debit/credit cards and review the check writing process....


