Curated OER
Graphs and Data
Pupils investigate poverty using graphs. In this algebra lesson, students collect data on the effects of poverty and use different rules to analyze the data. They graph and use the trapezoid rule to interpret the data.
Curated OER
Interpreting Data and Building Hypothesis
Students define the term species, and graph species data together with previously collected data at the National Zoo. They interpret graphed data and recognize patterns in the streamside quadrant versus hillside quadrant. Students use...
Curated OER
The Demographics of Immigration: Using United States Census Data
High schoolers work together to analyze United States Census data on immigration. They compare and contrast the data and determine how immigration numbers have changed over time. They calculate percentages and make their own...
US Department of Commerce
Featured Activity: Exploring Questions for the 2020 Census
Just what is the census for? Using data and census questions, class members explore how officials gather information. Then, they consider how the government uses the answers to determine how it spends its money with a collaborative...
Curated OER
Data Collection
Students investigate qualitative and quantitative data. In this statistics lesson, students gather data on heights and weights of people and graph the distribution. Students discuss the differences between qualitative and quantitative data.
Curated OER
Create Your Own Form
Students gather and organize data using a mock census form, and determine mean, mode, range, and median for sets of data.
US Department of Commerce
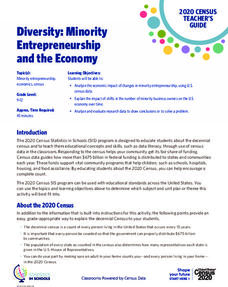
Diversity: Minority Entrepreneurship and the Economy
Using data from the Census Bureau, learners discover the growth in minority-owned businesses over time. After crunching numbers, analytical questions probe the reasons behind the shift.
American Statistical Association
Bubble Trouble!
Which fluids make the best bubbles? Pupils experiment with multiple fluids to determine which allows for the largest bubbles before popping. They gather data, analyze it in multiple ways, and answer analysis questions proving they...
Curated OER
Aboriginal Statistics
Fourth graders analyze statistics of Native Americans by creating graphs. In this data analysis lesson, 4th graders define different statistical terms and practice finding those statistics from groups of numerical information about...
American Statistical Association
Bear Hugs
Scholars research arm span to determine who gives the best bear hugs. They use data from a national study to find the standard statistics for arm span. It includes mean, median, quartiles, spread, standard deviation, and more.
American Statistical Association
Armspans
Young mathematicians collect data on the arm spans of classmates. Then they sort the data by measures of center, spread, and standard deviation. Finally, they compare groups, such as boys and girls, to interpret any differences.
National Endowment for the Humanities
People and Places in the North and South
North and South: two opposite directions and two opposite economic and social systems in time of the Civil War. Pupils peruse census websites and primary source photographs to understand what life was like for the everyday person before...
Curated OER
Being an Educated Consumer of Statistics
Students examine kinds of data used to report statistics, and create their own statistical report based on any of the four sources of media information (Internet, newspaper, TV, magazine).
Curated OER
Getting There
Students practice reading a pictograph. In this data analysis instructional activity, students collect data and create their own pictograph. A students worksheet is included.
Curated OER
Exploring Our Country: An United States Scavenger Hunt
Students visit a selected web site and search answers to given questions. They investigate census data for a several states. They explore data such as business, geography, and people. Students demonstrate ways to navigate through a...
Curated OER
Ohio Census 1990 & 2000
Students use Ohio census data to solve problems, make comparisons, draw conclusions, and support predictions related to Ohio's population. They interpret and work with pictures, numbers and symbolic information.
Curated OER
What Do You Know?
Students learn why the census makes a difference. In this U.S. Census lesson plan, students demonstrate knowledge and understanding of the census and its importance.
Curated OER
World Statistic Day
Eleventh graders collect data about the state they live in. In this statistics lesson, 11th graders collect and analyze data as they compare themselves to students in other states. They analyze data about a person's education level, and...
Curated OER
Mapping Counties
Students practice reading a map. In this mapping activity, students illustrate a map and compare and contrast the counties based on their population. Students also explore what a census is and read census data on a map. A student...
Curated OER
Reshaping the Nation
Young scholars learn why the census makes a difference. In this U.S. Census lesson plan, students learn how to read and use a cartogram while they explore new ways to represent data.
Curated OER
Farm Census
Students disuss the work of a farmer. They recognize and name farm animals to represent the information in a pictogram.
Curated OER
My Favorite Birthday
Students collect and organize data from classmates, display data on simple chart, and plan class birthday party.
Curated OER
How does Your Province Stack Up?
Students investigate data about age, and sex of a population. In this statistics instructional activity, students are given data on a population to analyze and compare to other provinces. This assignment is part of a geography...
Other popular searches
- Data, Census, & Statistics
- Analyzing u.s. Census Data
- Analyzing Census Data
- Data Census & Statistics
- Graphing Census Data
- United States Census Data
- Graphing Using Census Data
- 2010 Census Data
- Census Data 1860s
- Historical Census Data Browser
- Analyzing Us Census Data
- Data Census


