Curated OER
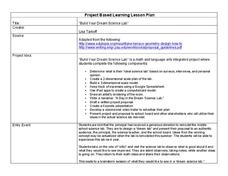
Build Your Dream Science Lab
Would your ideal science lab be filled with bubbling beakers and zapping Tesla coils? Or would it contain state-of-the-art computer technology and data analysis? Dream big with an innovative lesson that connects math and language...
Google
Graphing with Google Docs & Forms
Get to know your class and teach about data analysis all with the help of Google Docs. Using student-generated questions, create a class survey using Google Forms. Reserve time in the computer lab for learners to complete the form and,...
Curated OER
Creating a Graph
Students brainstorm favorite things to do during the summer. They survey classmates to collect data, arrange it in a chart, and create graphs using ClarisWorks.
Curated OER
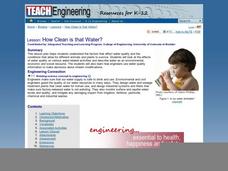
How Clean is the Water?
Students read about and discuss water and how it is used as a resource and how engineers use technology to preserve it. In this water lesson plan, students look at a picture of water treatment and tell what is wrong with the picture.
Curated OER
Learning, Communication, and 21st Century Skills: Students Speak Up
Students brainstorm to come up with examples of things they do with computers and write them down for the class to observe. They then raise their hands to respond to each survey question, tallying their answers on the board and engage in...
Curated OER
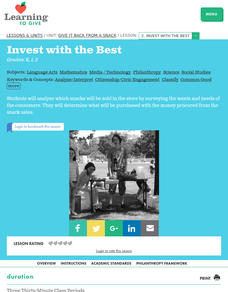
Give It Back From a Snack Lesson 2: Invest With the Best
Students survey schoolmate as to what type of snacks they would prefer to purchase. They graph the results and apply them to planning a classroom snack sale while examining what wants, needs, and consumers are.
Curated OER
Graphing Our Favorite Candy Bars
Learners use ClarisWorks to graph class' favorite candy bars on a bar graph.
Curated OER
Weather the Storm
Fourth graders complete multi-curricular activities for weather. In this weather lesson, 4th graders complete creative writing, research, and weather data analysis activities for the lesson.


