Earth Watch Institute
Entering Local Groundhog Data in an Excel Spreadsheet
Here is a cross-curricular ecology and technology lesson; your learners create spreadsheets depicting the location and number of groundhog dens in a local park. They research groundhogs and analyze data about where the groundhog...
Curated OER
Using Excel To Teach Probability And Graphing
Students engage in the use of technology to investigate the mathematical concepts of probability and graphing. They use the skills of predicting an outcome to come up with reasonable possibilities. Students also practice using a...
Curated OER
"Reality Math: Fact or Fiction"
Pupils investigate the use of math in everyday life. They investigate several occupations and pay scales. They complete spreadsheets that show how monthly bills can be organized using technology. They use word processing software to...
Sea World
Endangered Species
Study different endangered species with several activities that incorporate math, science, language arts, and research strategies. A great addition to your lesson on conservation or Earth Day.
Curated OER
Calculating Profits from Selling Virtual Lemonade
Students set up and collect data for a virtual lemonade stand. In this entrepreneurship, economics, and technology lesson plan, students purchase ingredients, determine costs, and set up a virtual lemonade stand. Students consider...
Curated OER
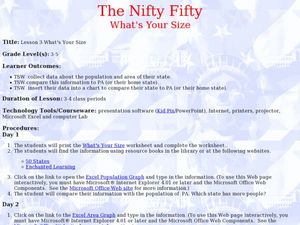
The Nifty Fifty-What's Your Size?
Learners explore state populations. In this state geography lesson, students use a variety of technology tools to research and graph population and area of assigned states.
Curated OER
Student Costs Data Table
Learners compare and contrast two routes selected for a virtual field trip. They create a data table of educational activities, lodging, and meal costs using Microsoft Excel software.
Curated OER
Data! Data! Graph that Data!
Fifth graders create data graphs using Microsoft Excel. In this data collection lesson, 5th graders create and conduct a survey, then use Excel to organize and graph their data.
Curated OER
State Economy Chart
Fifth graders research and record statistics on the economy of an assigned state. They create a spreadsheet in Excel to report the data and a 3D Pie graph using the Chart Wizard in Excel to represent their states' data.
Curated OER
Graphing and Analyzing Biome Data
Students explore biome data. In this world geography and weather data analysis instructional activity, students record data about weather conditions in North Carolina, Las Vegas, and Brazil. Students convert Fahrenheit degrees to Celsius...
Curated OER
Technology - Data Collection
Students collect and analyze data from the United States Census Bureau. Using spreadsheet technology, students explore their results and make preductions about income groups. Students compute the mean, median and mode. They create...
Curated OER
Predicting Temperature: An Internet/Excel Learning Experience
Third graders use the Internet (www.weather.com) to find the high temperature for our locale and the high temperature for another city around the world. They keep track of the temperature in these two locations for 10 days.
Curated OER
Food for Thought
Third graders conduct a survey of their class' favorite foods voting on 3-4 favorites overall. They then go to the computer lab and examine how to produce a horizontal bar graph by graphing the favorite foods of the class.
Curated OER
You mean college costs that much?
Seventh graders collect, organize, and analyze data as they research colleges on the Internet. They graph their collected data on a line graph and use a spreadsheet on Microsoft Excel in order to organize the data.
Curated OER
Virtual Field Trip: Lodging and Meals
Learners calculate the costs for lodging and meals for a virtual field trip. They calculate the number of nights lodging needed for road and city travel and the number of meals needed, the costs for each, and input the data using...
Curated OER
Survey Project
Eighth graders create a website using FrontPage. They use inserted forms to collect survey information and use Microsoft Excel and MS Word to create a presentation of the survey and the results.
Curated OER
Planet Protectors
Students explore ways to protect the earth. In this environmental issues and technology lesson, students investigate the water quality in their community and compare their findings to the water quality in other geographic...
Curated OER
Fast Food Fun
Students use technology to input, retrieve, organize, manipulate, evaluate, and communicate information to find calories and fat in a typical fast food meal. They decide which fast food restaurant you would like to visit and click on...
Curated OER
Using Excel, the Internet, And Word To Create a Spreadsheet, Chart, And Instructions
Students improve data entry in a spreadsheet.
Curated OER
And the Winner Is...
Students read the sports section of the daily newspaper to find daily totals of what countries have won medals and find articles to keep in their journal (notebook) on the different events and athletes. They then create a spreadsheet to...
Curated OER
Enhancing Writing Through Technology
Students participate in a class survey of their favorite activity to do in the snow and organize the results in a graph. They write a paragraph about the graph using language from a class-developed word web and include both an opening...
Curated OER
It's Your Life - Safe or Sorry/Safety Issues
Students examine and chart data about safety hazards and unsafe situations. In this safety hazard instructional activity, students examine newspapers and web sites to investigate injuries from safety hazards. They make a spreadsheet...
Teach Engineering
Live Like an Animal
When your parents say that your room's a pig sty, tell them about biomimicry. The sixth installment of a nine-part Life Science unit has scholars research the shelters used by animals in the natural world, like turtle shells. Using the...
National Wildlife Federation
Get Your Techno On
Desert regions are hotter for multiple reasons; the lack of vegetation causes the sun's heat to go straight into the surface and the lack of moisture means none of the heat is being transferred into evaporation. This concept, and other...


