Curated OER
The Numbers Tell the Story
Students demonstrate how to gather and interpret statistical data. In this data analysis lesson, students search for statistics on the health effects of smoking and place the information into charts. Students create these charts online...
Curated OER
Time Management: Piece of Pie
Middle schoolers examine their own lives and how well they manage their time outside of school. For this this time management lesson, students discover the amount of time they spend on other activities, and create a pie chart with that...
Curated OER
EXCEL It!
Students surf the Web gathering information about graphs. The data collected is incorporated into an Excel spreadsheet and graphs of varying nature generated to further enhance student understanding.
Curated OER
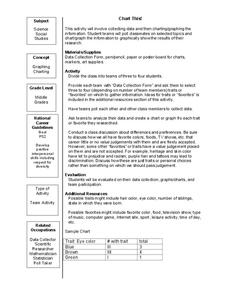
Chart This!
Students collect data and graph or chart the information. In this data organization lesson plan, students poll their classmates about certain topics and chart or graph the information to show the results of their research.
Curated OER
Using Spreadsheets and Graphs
Third graders explore mathematics by utilizing computers. In this graphing lesson, 3rd graders gather class data based on a particular topic such as the "favorite candy" of the class. Students utilize this information and computers to...
Curated OER
Investigating: Interpreting Graphs and Analyzing Data
Students explore statistics by researching class birthday data. In this data analysis instructional activity, students investigate the different birthdays among their classmates and create data tables based on the given information....
Curated OER
Bald Eagle Population Graphing
Students create graphs to illustrate the bald eagle population. They identify the population of bald eagles in Minnesota and the United States. They create three graphs to represent the population data including a line, bar, and...
Curated OER
Charting Weight
Sixth graders record the weight of themselves and 3 family over a week, and then use that data to compile 2 bar graphs and 4 line graphs and answer a series of questions.
Curated OER
How Has Math Evolved?
Eighth graders pick a topic or person to research related to the history of mathematics. They brainstorm and create a concept map, using the multimedia software inspiration, about what they are researching and want to examine. They then...
Curated OER
And the Survey Says...
Learners use technology to input, retrieve, organize, manipulate, evaluate, and communicate information; apply appropriate technologies to critical thinking, creative expression, and decision-making skills. They collect and explore data...
Curated OER
Paying for Crime
Learners participate in activties examining ratios and proportions. They use graphs to interpret data showing the government's budget for prisons. They present what they have learned to the class.
Curated OER
Dealing With Data
Students collect, organize, and display data using a bar graph, line graph, pie graph, or picture graph. They write a summary describing the data represented and compare the graph to another graph in the class.
Curated OER
The Lake Effect
Fourth graders conduct an experiment demonstrating the effects of water and air temperature on precipitation. They create graphs demonstrating their findings using Claris Works for Kids.
Curated OER
Student Costs Data Table
Young scholars compare and contrast two routes selected for a virtual field trip. They create a data table of educational activities, lodging, and meal costs using Microsoft Excel software.
Curated OER
Graphing Data on Ellis Island
Third graders use data to make a bar graph. In this graphing and social studies lesson plan, 3rd graders use data about where Ellis Island immigrants came from to complete a bar graph on Microsoft Excel.
Curated OER
Lesson 3: Seven Day Road Trip
Students plan a seven day road trip. In this travel lesson, students plan a driving trip that includes five major cities or attractions in Florida or another state of their choice. They show the trip on a map, calculate distances that...
Curated OER
Time Management
Students plot activities for a 24 hour day. They record their information on a spread sheet program. Students list categories they use and write equations for cells that add cells of each category together. Students create a pie chart of...
Curated OER
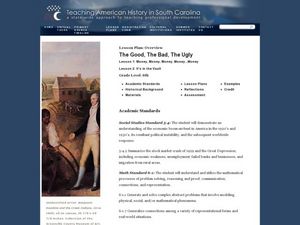
The Good, The Bad, The Ugly
Sixth graders examine the causes of the stock market crash of 1929. For this integrated math/history unit on the stock market, 6th graders study, research, and read stocks, visit a local bank, and create a PowerPoint to show the...
Curated OER
A Class Census
Students recognize that data represents specific pieces of information about real-world activities, such as the census. In this census lesson, students take a class and school-wide census and construct tally charts and bar graphs to...
Curated OER
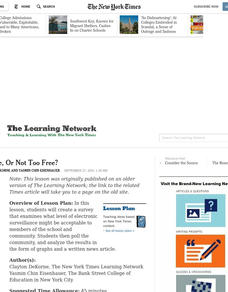
Too Free, Or Not Too Free?
Students create a survey that examines what level of electronic surveillance might be acceptable to members of the school and community. They poll the community, and analyze the results in the form of graphs and a written news article.
Curated OER
Mixing Mixed Numbers Art/Creating Fractions
Third graders explore number values by participating in class math activities. In this fractions lesson, 3rd graders collaborate with classmates to discuss the technique of adding mix numbers while utilizing paper plates to help...
Curated OER
Positive Future Fair Project
Ninth graders view the film "Pay It Forward" and discuss what kind of public campaign is needed to move people to positive action. They consider different ways of presenting information (graphs, visual displays, etc.) as tools for...
Curated OER
Integration and the "Barrier Breakers": Black Baseball 1945-1960
High schoolers explore integration of Major League Baseball, identify important individual baseball players who played key roles in integration, and analyze historical information through charts, graphs, and statistics.
Curated OER
Cold Enough?
Young scholars read and record temperatures and display the data. They represent the temperatures on an appropriate graph and explain completely what was done and why it was done. Students display the data showing differences in the...


