Curated OER
Songs from the Past
Young scholars research songs from the past to learn about historical events. In this music history lesson, students conduct a survey on the Star-Spangled Banner, research the song and history on various websites, and research songs in...
Curated OER
Charting Seasonal Changes
Students research the Earth's patterns of rotation and revolution, create a chart and graph of these patterns and use them to explain the causes of night and day and summer and winter.
Curated OER
The Lake Effect
Fourth graders conduct an experiment demonstrating the effects of water and air temperature on precipitation. They create graphs demonstrating their findings using Claris Works for Kids.
North Carolina State University
Exploring Genetics Across the Middle School Science and Math Curricula
Where is a geneticist's favorite place to swim? A gene pool. Young geneticists complete hands-on activities, experiments, and real-world problem solving throughout the unit. With extra focus on dominant and recessive genes, Punnett...
Curated OER
Student Costs Data Table
Young scholars compare and contrast two routes selected for a virtual field trip. They create a data table of educational activities, lodging, and meal costs using Microsoft Excel software.
Curated OER
A Nation of Nations Lesson Plan: Charting African Ethnicities in America
Students read a portion of the narrative, The Transatlantic Slave Trade, to explain the ethnic origins of enslaved Africans brought to the US. They create charts and bar graphs comparing ethnicities in the lowlands and tidewater regions.
Curated OER
Graphing a Healthy Lifestyle
Fifth graders, over a week, record the amount of time they spend sleeping, attending school, watching T.V., exercising and doing homework. At the end of the week the students graph all of their information and discuss how sleep impacts...
Curated OER
A Planet Full of Animals
Students study animals and practice classifying them through observation activities. In this animal classification lesson, students complete a KWL chart about animals. Students then sort pictures of animals into chart categories based on...
Curated OER
Lobster Business Charts
Students research four Maine based businesses involved with lobster fishery as a career analysis. In this career exploration lesson, students research lobster fishery businesses and write a class book showing the progression of a lobster...
Curated OER
A World of Information
Students analyze data and statistics about countries around the world. They read graphs and charts, color a world map to illustrate the top ten statistics about the world, and write a paragraph to summarize their information.
Curated OER
Science and Technology
Students research inventions that have been created. In this historical technology lesson, students read the Harcourt Brace social studies textbook and discuss how inventors used graphs to display data. Students create a table to write...
Curated OER
Weather Awareness
Second graders investigate weather. In this weather lesson, 2nd graders discover how to read a temperature gauge, keep track of the weather, and find out how the weather affects their day. They work individually and in partners to make...
Curated OER
Historical Population Changes in the US
Students conduct research on historical population changes in the U.S. They conduct Internet research on the Historical Census Data Browser, create a bar graph and data table using a spreadsheet program, and display and interpret their...
Curated OER
A Research Project and Article For the Natural Inquirer
Get your class to use the scientific process to solve a scientific problem. They utilize the Natural Inquirer magazine to identify a research question which they write an introduction to and collect data to answer. They use graphs,...
Sharp School
Geography Project
This very simple geography project can lead to a lot of useful referential information that can be displayed in your classroom! Learners construct a poster-size map of a country, identifying major demographic points and including pie/bar...
Curated OER
Understanding "The Stans"
Students explore and locate "The Stans" in Central Asia to create, write and illustrate maps, graphs and charts to organize geographic information. They analyze the historical and physical characteristics of Central Asia via graphic...
Curated OER
It's Your Life - Safe or Sorry/Safety Issues
Students examine and chart data about safety hazards and unsafe situations. In this safety hazard lesson, students examine newspapers and web sites to investigate injuries from safety hazards. They make a spreadsheet using the data and...
Curated OER
Ancient Greece and Ancient Rome Unit Plan
Students make two T charts, one for Sparta and one for Athens, showing pros and cons for living in either city-state. They use the physical information from the map and the cultural captions given for Athens and Sparts to come to their...
Curated OER
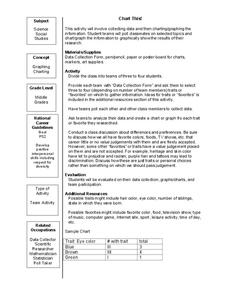
Chart This!
Students collect data and graph or chart the information. In this data organization activity, students poll their classmates about certain topics and chart or graph the information to show the results of their research.
Curated OER
Your Just Desserts
Students write letters to town officials and local businesses asking for favorite dessert recipes. They tabulate their responses in a spreadsheet. Students turn their survey results into colorful graphs.
Curated OER
Bird Bulletins
Students, in groups, create a survey to investigate how much their community knows about birds. They graph their findings using a bar graph. Using the data collected, they develop an advertising campaign to increase community awareness...
Curated OER
Using My Nasa Data To Determine Volcanic Activity
Students use NASA satellite data of optical depth as a tool to determine volcanic activity on Reunion Island during 2000-2001. They access the data and utilize Excel to create a graph that has optical depth as a function of time for the...
Curated OER
Weather Report Chart
Learners complete a weather report chart after studying weather patterns for a period of time. In this weather report lesson, students measure temperature, precipitation, cloud cover, wind speed, and wind direction for a month. Learners...
Curated OER
Math: Football Fever Fun
Students compile statistics from high school or other football team and construct a spreadsheet on which to record their findings. Using Chart Wizard to analyze the data, they construct charts and graphs for a visual display of the...
Other popular searches
- Pie Charts and Graphs
- Reading Charts and Graphs
- Behavior Charts and Graphs
- Charts and Graphs Candy
- Interpret Charts and Graphs
- Charts and Graphs Christmas
- Charts and Graphs Math
- Analyzing Charts and Graphs
- Tables, Charts and Graphs
- Charts and Graphs Europe
- Using Charts and Graphs
- Bar Graphs and Charts


