Curated OER
Local Linearity
In order to investigate local linearity, students graph the function on the TI-calculator and zoom to observe the change in slope on the line. They incorporate technology to visualize these problems.
Curated OER
Optimization
Learners identify the critical points to a function. In this calculus lesson, students perform optimization of functions. They use the TI to create a visual of the graph.
Curated OER
Taylor Polynomial Examples
Students graph Taylor polynomials. In this calculus lesson, students relate accuracy of a Taylor polynomial to the degree of the equation. They graph their polynomials using the TI calculator.
Curated OER
Taylor Polynomials
Pupils graph Taylor polynomials in this calculus lesson. They observe the graphs for the expansion of Taylor polynomial functions and use the Ti calculator to help create visuals of the graphs.
Curated OER
Polar Graphs
Students graph polar graphs. In this calculus lesson, students convert between polar and rectangular coordinates. They graph their solution on the TI calculator and make observations.
Curated OER
Creating a Midpoint Quad
Using a TI Navigator to drag quadrilaterals around to create different shapes, young scholars learn how to draw midpoints in their quadrilaterals. In this geometry lesson plan, students solve problems using the properties of...
Curated OER
Solving Systems using Elimination
Using elimination to find the point of intersection of two lines, students learn to solve systems of equation. They graph their solutions and use the TI to verify the solution.
Curated OER
Critical Points
High schoolers identify critical points on a graph. In this calculus lesson, students graph their equations on the TI calculator. They zoom in and out to identify the critical points.
Texas Instruments
Continuity and Differentiability 1
Pupils examine graphs for continuity and differentiability in this calculus lesson plan. They observe piecewise functions to see where continuity and differentiability come into play. Learners finish by graphing their equation on the TI...
Curated OER
Slope Fields
Students create and analyze slope fields. For this calculus lesson, students create a visual of differential equations. They use the Ti Navigator to create slope fields.
Curated OER
Triangle Sum Theorem
Teach your class how to solve problems using the triangle sum theorem. In this geometry lesson, students identify the missing angles in a triangle using the sum theorem. They graph triangles on the TI and moves the sides around to create...
Curated OER
Creating a Cyclic Quadrilateral
Identify and make conjecture about properties of cyclic quadrilaterals. Students use the TI Navigator to create different shapes and draw conclusions.
Curated OER
Solving Systems with Row Operations 2
Have your class solve equations using matrices by teaching them how to factor systems of equation to identify the point of intersection. They create their matrices on the Ti and perform row operations to simplify.
Curated OER
Angles and Arcs
Students identify the relationship between angles and arcs. In this geometry lesson, students rotate and move the circle around to create different arcs on the TI-Navigator. They differentiate between major and minor arcs.
Curated OER
Introduction to Conic Sections
Learners slice cones and identify the different conics formed. They then derive the formula to solve problems involving cones. Pull out the TI calculators to visualize the slicing and the different parts and properties created.
Curated OER
Epsilon-Delta Window Challenge
Students graph functions and analyze them. In this calculus instructional activity, students define limit formally using Epsilon-Delta. They use the TI to graph the function and analyze it.
Curated OER
Basic Limits
Learners calculate the limits of functions. In this calculus lesson, students find the left and right handed limits of different functions. They use the Ti Navigator to drag the function around as they study limits.
Curated OER
Newton's Method
Student approximate the roots of E using Newtons Method. In this calculus lesson, young scholars calculate the equation of tangent a line. They use the TI to visualize the tangent line.
Curated OER
Integration By Substitution
Young scholars calculate the solution using integrals in this calculus instructional activity. They use the TI to create a visual of how to compute integrals. Learners also use substitution by integration and all its properties.
Texas Instruments
Integration By Parts
Pupils solve problems using integration by parts in this calculus lesson. Learners apply the product rule and integration by parts. They graph the equation and use the TI to observe the integration process.
Texas Instruments
Convergence of Taylor Series
Young scholars analyze taylor series for convergence. In this calculus lesson, students analyze the graph of a taylor series as it relates to functions. They use the TI calculator to graph and observe the different series.
Curated OER
Points on a Line
How do you find slope? You use points on a line of course. slope. Teach your class how to calculate and differentiate between horizontal and vertical lines. They are sure to be pros at graphing lines on a coordinate plane by the end of...
Curated OER
Exploring Graphs of Inequalities
Learn how to solve inequalities and graph their answers. Students use addition, subtraction, multiplication and division to solve problems. They analyze their graph using the TI calculator.
Curated OER
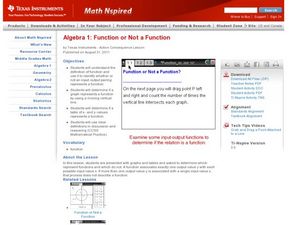
Function or Not a Function
Graphing linear equations on the TI is easy! Through examination of graphs and identification if it is a function or not, this activity can relate to the real world.


