Curated OER
Discussing How Plants Grow
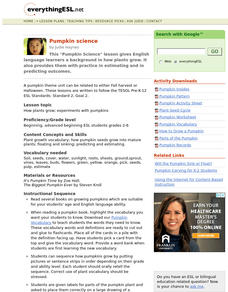
Study how plants grow with your English language learners with a cross-curricular lesson revolving around pumpkins. These activities provide opportunities to practice new scientific vocabulary while practicing skills such as estimating...
Curated OER
Dusty Locks and the Three Bears
Read this twist on Goldilocks and the Three Bears: Dusty Locks and the Three Bears by Susan Lowell. Kindergartners listen, predict, and discuss the story. They then participate in a dramatization of the story and draw a picture...
Curated OER
Ancient Greece Predicting Outcomes
Sixth graders explore world history by utilizing a SMART board. In this Greek history lesson, 6th graders read different Ancient Greece scenarios and match them with a selection from a list of probable outcomes. Students identify Mt....
Curated OER
Reading
Young scholars are introduced to various types of folk tales. During a read-aloud, they predict what they believe is going to happen next and practice following the story line. To end the lesson, they answer comprehension questions and...
Curated OER
Probabilities for Number Cubes
Students explore the concept of probability. In this probability lesson, students roll a six-sided number cube and record the frequency of each outcome. Students graph their data using a frequency chart and keep tally marks...
EngageNY
Calculating Probabilities of Events Using Two-Way Tables
Tables are useful for more than just eating. Learners use tables to organize data and calculate probabilities and conditional probabilities.
Curated OER
Spinning Probability
Sixth graders study the concept of probability. For this probability lesson, 6th graders create spinners that match specific sets of clues. Students use their spinners and worksheets to explore and predict probability.
Curated OER
Introducing the Memo
Examine the text structure of a memo with this worksheet. Eighth to twelfth graders decide if the purpose of a memo is to motivate an action or to provide information to the reader. They explore new vocabulary and make predictions prior...
Curated OER
Probability
Third graders conduct experiment, collect data, predict, record, and discuss outcomes, and analyze data for probability.
Curated OER
Probability
Fifth graders study probability of events. They predict outcomes, and participate in hands-on experiments to find the probability of specified events. Afterward, 5th graders write probability of events in fractions and decimals.
Curated OER
Request
Learners play a game of questioning with the teacher after reading silently a beginning passage of text. They and teacher request specific information from each other until students are able to summarize and predict the outcome of the...
Curated OER
The Magical Diving Sub
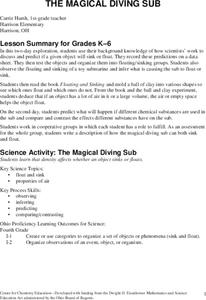
First graders discuss and predict if a given object sinks or floats. They record their predictions on a data sheet. Pupils test the objects and organize them into floating/sinking groups. Students observe the floating and sinking of a...
Curated OER
Linear and Quadratic Model, Data Modeling
Students model quadratic and linear equations. In this algebra instructional activity, students solve word problems using equations. They create scatter plots and make predictions using correlations.
Curated OER
My Community Book
Young learners examine different places in their neighborhood using informational texts. First they identify a place that they like to play and predict if it will be in the nonfiction book Community at Play.They will share their favorite...
Curated OER
Dependence of Light Intensity on Distance
Hopefully you have a sensor interface for your physics class to use with graphing calculators when collecting data with a light sensor. If so, read on. Use this resource for learners to predict and then test whether or not the intensity...
Virginia Department of Education
Growing Patterns and Sequences
Learners explore, discover, compare, and contrast arithmetic and geometric sequences in this collaborative, hands-on activity. They build and analyze growing patterns to distinguish which kind of sequence is represented by a set of data...
EngageNY
Modeling an Invasive Species Population
Context makes everything better! Groups use real data to create models and make predictions. Classmates compare an exponential model to a linear model, then consider the real-life implications.
Beyond Benign
Punnett Square Possibilities
Discover possible genetic outcomes through Punnett Squares. Learners continue studying genetic traits in the 10th lesson in the 17-part series. After determining the father of Sparky's kittens, scholars now attempt to predict the traits...
Curated OER
In Touch with Apples
Students read "How To Make an Apple Pie and See the World", the story of a girl who traveled the world to find the ingredients to make her apple pie. They conduct a series of interdisciplinary activities including testing their senses,...
Utah Education Network (UEN)
Geo Shapes
Invite your first graders to compose and decompose two and three-dimensional figures with this fun, hands-on lesson. They investigate and predict the results of putting together and taking apart two-dimensional shapes with rubber bands...
Curated OER
Sink or Float?
Young scholars predict and test different items to see if they sink or float. In this sink and float lesson plan, students predict whether an item is buoyant or not, and learn that size and weight do not matter when it comes to buoyancy.
Curated OER
Analyzing the Relationship between Snowpack and River Flow
Students use the Internet to research current and past snowpack levels and river gauging station readings. They determine the relationship between snowpack and river flow. They predict future river flow.
Curated OER
Discovering Ohm's Law
Connect math with science! Pupils apply properties of Ohms Law as they solve problems and identify the inverse relationship of a function. They analyze the shape of the graph of an inverse function and use it to make predictions.
Curated OER
Modeling Linear Relationships
Students graph lines using the slope and y-intercept. In this algebra lesson, students create data using tables and equations. They use their data to make predictions and draw conclusion.


