Statistics Education Web
What Does the Normal Distribution Sound Like?
Groups collect data describing the number of times a bag of microwave popcorn pops at given intervals. Participants discover that the data fits a normal curve and answer questions based on the distribution of this data.
EngageNY
Normal Distributions (part 2)
From z-scores to probability. Learners put together the concepts from the previous lessons to determine the probability of a given range of outcomes. They make predictions and interpret them in the context of the problem.
Statistics Education Web
Using Dice to Introduce Sampling Distributions
Investigate the meaning of a sample proportion using this hands-on activity. Scholars collect data and realize that the larger the sample size the more closely the data resembles a normal distribution. They compare the sample proportion...
Radford University
Survey Activity
It's time to take a survey. After looking at an example of a survey on lunch preferences, groups design their own surveys. They consider the sample size and sampling technique, then conduct the surveys. As a final activity, they create...
Statistics Education Web
Who Sends the Most Text Messages?
The way you use statistics can tell different stories about the same set of data. Here, learners use sets of data to determine which person sends the most text messages. They use random sampling to collect their data and calculate a...
Statistics Education Web
Now You SeeIt, Now You Don't: Using SeeIt to Compare Stacked Dotplots to Boxplots
How does your data stack up? A hands-on activity asks pupils to collect a set of data by measuring their right-hand reach. Your classes then analyze their data using a free online software program and make conclusions as to the...
Curated OER
The Bell Curve
Learners explore the concept of the bell curve. In this bell curve lesson, students discuss the controversy associated with the bell curve. Learners use an applet to explore a normal distribution. Students discuss mean, median, mode,...
Curated OER
Looking Normal
Young scholars identify the shape of a function. In this statistics lesson, students plot the data collected. They analyze their data for positive, negative or no correlation. They find the line of best fit.
Statistics Education Web
Walk the Line
How confident are you? Explore the meaning of a confidence interval using class collected data. Learners analyze data and follow the steps to determine a 95 percent confidence interval. They then interpret the meaning of the confidence...
Stats Monkey
Everything I Ever Needed to Learn about AP Statistics I Learned from a Bag of M and M's®
Candy is always a good motivator! Use this collection of M&M's® experiments to introduce statistics topics, including mean, standard deviation, nonlinear transformation, and many more. The use of a hands-on model with...
Illustrative Mathematics
Do You Fit In This Car?
A short activity that focuses on the normal distribution as a model for data distribution. Using given means and standard deviations, your budding statisticians can use statistical tables, calculators, or other statistical software to...
Illustrative Mathematics
SAT Scores
If you earned a score of 610 on the math portion of the SAT, what would be your percentile ranking? Given the mean and standard deviation of normally distributed data, find the probability of getting a particular score, or that your...
Curated OER
Application and Modeling of Standard Deviation
The first activity in this resource has learners computing the mean and standard deviation of two different data sets and drawing conclusions based on their results. The second activity has them using a dice-rolling simulation to...
Curated OER
Electric Power Transmission and Distribution
Students explain how power is transmitted over long distances. In this physics lesson, students simulate controlling power flow in parallel transmission lines. They discuss several applications of wireless power transmission.
Curated OER
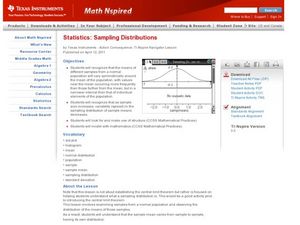
Sampling Distributions
Students analyze sampling from different population. In this statistics lesson, students define the meaning of sample sizes and what causes an increase or decrease. They graph their data on the Ti calculator and draw conclusion from the...
Curated OER
Assessing Normalcy
Learners define normal distribution as it relates to the bell curve. In this statistics lesson, students use the central tendencies of mean, median and mode to solve problems. They plot their data and draw conclusion from the graphs.
Curated OER
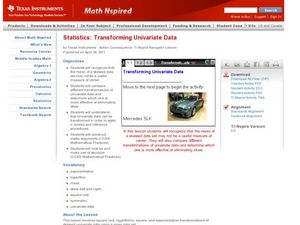
Transforming Univariate Data
Learners analyze plotted data in this statistics lesson. They differentiate between skewed and normal data. They also explore and interconnect exponential growth and decay as it relates to the data.
Curated OER
Using Blood-Typing to Determine Causes of Death in Surgery Patients
For this simulation activity, young biologists examine blood types to determine whether the death rate in a hospital was caused because of incorrect identification of patient blood types. You will need obtain and follow the procedures of...
Rochester Institute of Technology
Hazmat Disposal
What a waste! The last installment of a nine-part technology/engineering series teaches learners about medical waste disposal systems. Conducting a simulation allows individuals to understand how monetary considerations constrain waste...
Curated OER
Bell Curve
Students explore averages by completing a data analysis activity. In this bell curve lesson, students measure different food items and plot their measurements on a X and Y axis. Students create bell curves around the average weight or...
Curated OER
Trash Inventions
Second graders develop a plan to recycle trash. In this environmental science lesson, 2nd graders sketch their invention and construct it. They present the final product in class.
Curated OER
Is It Recyclable?
Learners bring to school five items they would normally throw away and five items they would normally recycle. Expert groups are formed to present information on the recycling of glass, metal, plastic, and organics such as paper and...
Curated OER
Apoptosis: Programmed Cell Death During Development
Students model the plasticity of neural pathways for memory in the brain. They simulate the cell activity according to dots on cards that they are given. They complete various simulations of different cell combinations.
Curated OER
The 3R's: Rights, Rules, and Responsibilities
Eighth graders complete seven work stations that highlight math activities while they focus on the rules for Internet use and classroom rules for working in cooperative groups. After completing the activities, they complete a self-...


